Buy Niva Bupa Ltd for the Target Rs. 92 by Motilal Oswal Financial Services Ltd
Combined ratio hit by higher opex and claims
* Niva Bupa (Niva) reported 17% YoY growth in NEP to INR14.2b (in-line) in 2QFY26. For 1HFY25, NEP grew 18% YoY to INR26.4b.
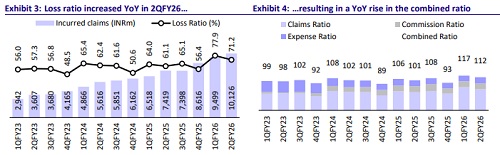
* The loss ratio at 71.2% (our est. of 66.9%) jumped 1,000bp YoY. The ratio was hit by 1/n accounting, as well as a higher group health loss ratio due to 50% URR accounting. An opex ratio of 21.2% (vs. our est. of 18.9%) and the commission ratio of 19.3% (vs. our est. of 20.2%) resulted in a combined ratio of 111.7% (vs. our est. of 106%), up 1,040bp YoY.
* The loss for 2QFY26 was INR353m vs. a PAT of INR130m in 2QFY25 (vs. our est. of PAT of INR381m). For 1HFY26, loss was INR1.3b vs. a loss of INR58m in 1HFY25.
* After the GST exemption, customer behavior has shifted toward higher coverage, reflected in the rise in ticket sizes for both new and renewal policies. Importantly, Niva has passed the entire GST impact to distributors. Management reaffirmed its medium-to-long-term RoE guidance in the midto-high teens.
* We cut our PAT estimates for FY26/27/28 by 49%/14%/9%, considering the performance in 1HFY26. However, this impact was largely due to 1/n accounting and the elevated group health loss ratio due to 50% URR accounting. Hence, we broadly retain our IFRS estimates. We value the stock at 32x Sep’27E IFRS PAT to arrive at a fair value of INR92. Reiterate BUY.
IFRS PAT experiences ~2x jump in 1HFY26
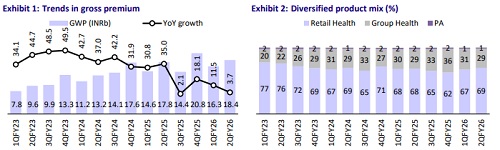
* GWP grew 4% YoY to INR18.4b, driven by 6%/3% YoY growth in retail health/group health, while the PA business declined 39% YoY. On a pre1/n basis, GWP grew 19% YoY, with retail health growing 24.5% YoY.
* The underwriting loss for 2QFY26 came in at INR1.8b vs. the underwriting loss of INR881m in 2QFY25 (est. loss of INR1b), with net incurred claims growing 36% YoY to INR10.1b (5% above estimates) and 10% YoY growth in operating expenses to INR3.1b.
* The commission ratio was at 19.3% (vs. our est. of 20.2%) with net commission flattish YoY at INR2.8b (6% below estimates).
* Without considering the impact of 1/n, the claims ratio for 1HFY26 increased to 69.1%, while the expense ratio (including commission) improved to 37.1%, leading to a combined ratio of 106.2% (103.5% in 1HFY25). With the impact of 1/n, the claims/expenses/combined ratios were 74.3%/39.9%/114.1% for 1HFY26.
* Investment assets stood at INR84.8b at the end of 2QFY26, with investment yield at 7.3%. The solvency ratio was 2.85x in 2QFY26.
* The average ticket size per policy (without 1/n) increased to INR31,037 in 1HFY26 from INR30,839 in 1HFY25, while GWP contribution from >INR1m sum insured increased to 83.8% in 1HFY26 from 74.1% in 1HFY25. With the GST exemption announced, the contribution from the higher sum insured is increasing, as witnessed in Oct’25.
* The IFRS claims ratio for 1HFY26 rose to 65.9% (from 64.7% in 1HFY25), with the retail health loss ratio broadly stable YoY at 68.1%. However, the group health loss ratio was elevated. The expense ratio improved to 37.2% in 1HFY26 (39.5% in 1HFY25), resulting in an improvement in the combined ratio to 103.1% (104.2% in 1HFY25).
* IFRS PAT grew ~2x to INR1.3b (from INR0.6b in 1HFY25).
* The company’s hospital network was at 10,507 (10,488 at the end of 1QFY26), while the preferred partner network increased to 855 for 1HFY26 (681 at the end of 1QFY26).
* The channel mix remained largely stable, with 30.6%/19.8%/10.5%/28.0%/10.5%/ 0.6% of the business being contributed by agents/banks/other corporate agents/ brokers/ direct/ others. Strong growth is being witnessed in the agency, direct channel, and digital partner channels post-GST exemption.
Key takeaways from the management commentary
* The newly launched ReAssure 3.0 has received strong traction since its rollout during the quarter, helping enhance product differentiation. The launch led to a temporary increase in advertising expenses during the quarter.
* The GST exemption on health insurance has significantly boosted demand and customer affordability. In October 2025, despite the festive season, the retail health business grew over 50% YoY, with a surge in web traffic, query volumes, and conversions — consistent with broad industry trends.
* The EoM ratio improved to 35.5% in 1HFY26, aided by lower gross commission (as a % of GWP) and stronger scale efficiencies. Management expressed confidence in bringing the EoM ratio within the regulatory threshold by the end of FY26.
Valuation and view
* Niva witnessed the impact of 1/n accounting as well as an elevated group health loss ratio on its profitability, while the retail health loss ratio remained largely stable. While opex witnessed an increase due to a new product launch during the quarter, the EoM ratio declined in 1HFY26 and is expected to achieve the regulatory limit of 35% by FY26.
* We believe Niva has a strong position to harness the growth opportunity, with a strategic global partner, a growing customer base, a diversified channel mix, and innovative product offerings. Measures taken to mitigate claim inflation will continue to aid loss ratios, while operational efficiency will lead to expense ratio improvement going forward.
* We cut our PAT estimates for FY26/27/28 by 49%/14%/9%, considering the performance in 1HFY26. However, this impact was largely due to 1/n accounting and the elevated group health loss ratio due to 50% URR accounting. Hence, we broadly retain our IFRS estimates. We value the stock at 32x Sep’27E IFRS PAT to arrive at a fair value of INR92. Reiterate BUY.
For More Research Reports : Click Here
For More Motilal Oswal Securities Ltd Disclaimer
http://www.motilaloswal.com/MOSLdisclaimer/disclaimer.html
SEBI Registration number is INH000000412