Buy Baazar Style Retail Ltd For Target Rs.410 By JM Financial Services Ltd

Style Baazar’s 2QFY26 print was robust, aided by early festivities and strong SSSG of 22%; SSSG, even normalised for the festive season, was a robust 19%. Given the strong 1H performance, the management has now raised its revenue guidance to 25-30% for FY26, despite registering 55% growth in 1H; we believe the guidance is conservative. Operational performance, on the other hand, was below expectations due to sharp increase in rentals/sqft coupled with higher manpower cost. The management highlighted that these costs are expected to sustain at current levels and not accelerate. We note that 2H may witness incremental costs with respect to tech implementations coupled with EoSS falling in 4Q. Depreciation is also expected to be higher given the change in the lease accounting methodology. Baking in all of these, we cut our FY26-28 Pre-Ind AS EPS estimates by 12-20%, resulting in a cut in our target price to INR 410 (from INR 450) despite roll-over of our target multiple of 30x P/E to Sep’27. We maintain BUY. We believe re-rating in the stock will happen when a higher portion of the top line growth starts flowing into PAT; the same has been missing so far given the higher investments towards manpower and enhancement of tech capabilities. We note that reported PAT numbers are not comparable due to re-assessment of lease term estimates.
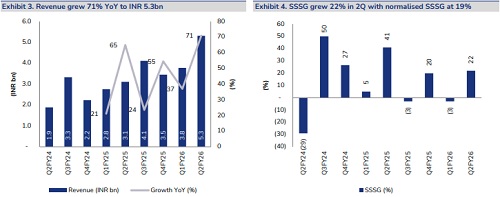
* Healthy SSSG and area expansion drives growth: The company reported strong revenue growth of 71% YoY to INR 5.3bn driven by the early onset of festivities leading to SSSG growth of 22% YoY (19% adjusted for the early festive season). Retail area expanded by ~39% YoY, sales density also remained robust, up 22% YoY to INR 10,380 (annualised) reflecting strong growth momentum. The company added 18 new stores in 2QFY26, taking the total store count to 250 stores. Total retail area stands as at 2.3mn sqft with average store size of new stores rising ~8% to 10.2k sqft in 2Q
* Strong throughput and rising private label share: Bill cuts per store increased by ~25% YoY to ~22.5k bills per store while ASP increased by 5% YoY to INR 273. However, items per basket declined by 4% YoY to 3.69 items, resulting in only a modest 1% YoY increase in average transaction value per bill to INR 1,005. The share of private label continued upwards trajectory, expanding by 1,270bps YoY to 57.7% with the management targeting ~ 65% over the next few years
* Margins expand YoY but miss estimates: EBITDA grew 1.8x YoY to INR 691mn, (9% miss JMFe), as margin expanded ~520bps YoY to 13% (JMFe: 14.3%). The improvement was driven by operating leverage, with staff cost and opex declining 170bps and 260bps respectively, and gross margin improving 90bps YoY to 30.5% aided by a higher private label mix offsetting 100bps YoY decline in general merchandise sales (a margin-accretive category). On a pre-Ind AS basis, EBITDA increased 10x YoY to INR 333mn, with margin expanding by a similar ~520bps to 6.3%, reflecting underlying operating strength.
* Re-assessment of lease term impacts profit reporting: APAT stood at INR 101mn, led by 73% YoY growth in other income, but it was partly offset by an 88% YoY increase in depreciation and 7% YoY increase in interest costs following a change lease term estimates during the quarter. This change resulted in an exceptional gain of INR 552.6mn (INR 413.5mn net of tax), and reported PAT of INR 515mn which is not comparable to previous periods. On Pre-Ind AS basis PAT stood at INR 155mn, giving a clearer picture of profitability.
Please refer disclaimer at https://www.jmfl.com/disclaimer
SEBI Registration Number is INM000010361