Buy Niva Bupa Ltd for the Target Rs.97 by Motilal Oswal Financial Services Ltd
Strong performance; loss ratio and combined ratio beat estimates
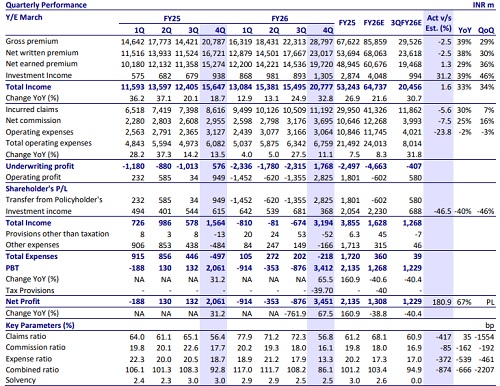
* Niva Bupa (NIVABUPA) reported 29% YoY growth in NEP to INR19.7b (in line) in 4QFY26. For FY26, NEP grew 24% YoY to INR60.7b.
* The loss ratio at 56.8% (our est. of 60.9%) increased 40bp YoY. Opex ratio was at 13.3% (our est. of 17%), with a 2% YoY decline in operating expenses to INR3.1b (24% beat). The commission ratio was 16.1% (our est. of 16.9%); it improved owing to the passing of the GST impact on distributors.
* Rise in claims ratio was far more than offset by operating efficiency, which led to a combined ratio of 86.1% (vs. est. of 94.9%). Combined ratio for the year was at 103.4% vs 101.2% in FY25.
* Under IFRS, combined insurance service ratio (CISR) improved to 97.4% in 4QFY26 vs 102% in 4QFY25. For FY26, CISR improved to 101.4% vs 103% in FY26.
* For 4QFY26, IGAAP PAT was at INR3.5b, a jump of 67.5% YoY, while IFRS PAT surged 89% YoY to INR1.6b. For FY26, IGAAP PAT declined 39% YoY to INR1.3b, while IFRS PAT at INR3.7b saw a growth of 80% YoY.
* CISR is expected to improve from 101.4% in FY26 to 99% by FY29. While the loss ratio will probably increase by 100-150bp, expense ratio savings will drive an improvement. At these levels, RoE will be in mid teens.
* We raise our IFRS PAT for FY27E/FY28E by 6%/11%, primarily led by improved performance across parameters in 4QFY26. We value the stock at 30x FY28E IFRS PAT to arrive at our TP of INR97. Reiterate BUY
IFRS PAT rises 89% YoY in 4Q
* GWP grew 39% YoY to INR28.8b, driven by 49%/23% YoY growth in retail health/group health, while the PA business saw a decline of 7% YoY. For FY26, GWP grew 27% YoY to INR85.9b.
* The underwriting profit for 4QFY26 came in at INR1.8b vs. INR576m in 4QFY25 (est. loss of INR407m), with net incurred claims growing 29.9% YoY to INR11.2b (6% beat) and 2% YoY decline in operating expenses to INR3.0b (24% beat).
* Commission ratio was at 16.1% (vs our est. of 16.9%), with net commission growing 25% YoY to INR3.6b (8% beat).
* Reported claims ratio was at 56.8% vs 56.4% YoY, while for FY26, it increased from 61.2% to 68.1%. Claims ratio under IFRS saw an increase to 64.9% from 63.8%.
* Investment assets stood at INR97b at the end of FY26, with investment yield at 7.2%. The solvency ratio was 2.49x at the end of 4QFY26.
* The average ticket size per policy (without 1/n) rose to INR34,461 in FY26 from INR33,135 in FY25. In contrast, the GWP contribution from the >INR1m sum insured rose to 88.2% in FY26 from 76.3% in FY25.
* The IFRS claims ratio for FY26 rose to 64.9% (from 63.8% in FY25), with the retail health loss ratio increasing to 66.8% from 66% in FY25. The expense ratio improved to 33.7% in FY26 (39.2% in FY25), resulting in an improvement in the combined ratio to 101.4% (103% in FY25).
* The company’s hospital network was at 10,566 (10,421 at the end of FY25), while the preferred partner network increased to 1,116 for FY26 (589 at the end of FY25).
* The channel mix remained diversified, with 30.2%/19.5%/10.4%/29.5%/9.7%/0.6% of the business being contributed by agents/banks/other corporate agents/brokers/direct/others in FY26. The company has added 14,000 agents in 4QFY26, taking the agent count to 238,517. It formed five banca partnerships in 4QFY26, taking the total partnerships to 121.
Valuation and view
* NIVABUPA reported a strong performance in 4QFY26, led by tailwinds from GST exemption on retail health insurance. This led to a significant improvement across all financial parameters. Higher fresh growth drove down the loss ratios, while opex ratio benefited from operating leverage. Favorable negotiations with distributors on GST as well as a cut in commissions on senior citizen policies have driven commission ratio improvement.
* We believe NIVABUPA has a strong position to harness the growth opportunity, with a strategic global partner, a growing customer base, a diversified channel mix, and innovative product offerings. While loss ratios are expected to rise going forward, they will be offset to some extent by operational efficiency.
* We raise our IFRS PAT for FY27E/FY28E by 6%/11%, primarily led by improved performance across parameters in 4QFY26. We value the stock at 30x FY28E IFRS PAT to arrive at our TP of INR97. Reiterate BUY.


For More Research Reports : Click Here
For More Motilal Oswal Securities Ltd Disclaimer
http://www.motilaloswal.com/MOSLdisclaimer/disclaimer.html
SEBI Registration number is INH000000412