Buy CAMS Ltd for the Target Rs. 920 by Motilal Oswal Financial Services Ltd
Strong momentum in the non-MF business
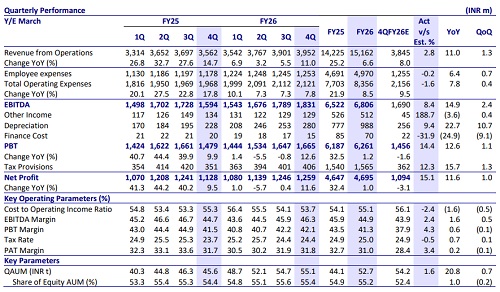
* CAMS reported operating revenue of INR4b in 4QFY26 (in line), up 11% YoY, driven by 9% YoY growth in MF revenue and strong growth of 24% YoY in non-MF revenue. For FY26, revenue came in at INR15.1b, up 6% YoY.
* Total operating expenses grew 8% YoY to INR2.1b (in line). Employee expenses/other expenses grew 6%/10% YoY to ~INR1.3b/INR868m. EBITDA came in at INR1.8b, up 15% YoY, reflecting an EBITDA margin of 46.3% (vs 44.7% in 4QFY25 and our est. of 43.9%). For FY26, EBITDA rose by 5% YoY to INR6.7b.
* PAT grew 12% YoY/remained flat QoQ at INR1.3b (15% beat, led by strong operating leverage), with a PAT margin of 31.8% vs. 31.7% in 4QFY25. For FY26, PAT dipped 2% YoY to INR4.6b.
* Going ahead, yields are expected to decline by less than 3% annually, with no significant pricing pressure anticipated from AMC negotiations. The company maintains more than 20% revenue growth guidance in the non-MF segment (~24% YoY in 4QFY26), with an aim to achieve 20%+ EBITDA margins in this segment (over 16% in 4QFY26).
* We have largely maintained our estimates. We expect revenue/EBITDA/PAT to post a CAGR of 13%/15%/16% over FY26-28. We reiterate a BUY rating on the stock with a revised TP of INR920 (based on 36x FY28E P/E).
Robust 20%+ growth across key non-MF segments
* CAMS’ AAUM grew 21% YoY/remained flat QoQ to INR55.1t in 4QFY26, with a market share of ~68%. Equity mix stood at 55.4% vs 54.4% in 4QFY25 and 55.6% in 3QFY26. Equity AUM rose 23% YoY to INR30.5t.
* MF revenue grew 9% YoY to INR3.3b (flat QoQ amid volatility and weak NFOs), contributing ~85% to total revenue; asset-based income formed ~86% of MF revenue, with ~14% from non-asset streams.
* SIP momentum remained strong with 12.6m new registrations in 4QFY26 (+46% YoY vs industry at 37% YoY), while transaction volumes rose to 293m (+23% YoY, +7% QoQ) and investor folios increased 21% YoY to 114.1m.
* Equity net sales share rose to 76.3% (vs 71% in 3QFY26), while the unique investor base grew 18% YoY to 47.6m, outpacing industry growth of 13%.
* Non-MF revenue grew ~24% YoY, consistently exceeding 20% guidance over the past three years, with momentum expected to sustain; it now contributes ~15.3% of revenue, with broad-based 20%+ growth across segments (Payments, AIF, KRA, etc.).
* CAMSPay delivered 22.8% YoY growth in 4QFY26, driven by strong traction in payment gateway/card payments, with non-MF now contributing over 50%, led by credit card, insurance, and NBFC use cases. ? CAMS Alternatives delivered strong performance with 25.4% YoY revenue growth in 4QFY26 (highest-ever quarterly); with AUM surpassing INR3.1t and >50% outsourced market share, it reinforced leadership by winning 44 mandates, including 14 marquee clients.
* CAMS KRA delivered 28% YoY growth despite industry headwinds, aided by new broker additions; while Apr’26 pricing cuts may impact FY27 revenue by ~INR80m, this is expected to be largely offset by NSE KRA contributions (INR25- 30m) and balance led by volume-led growth and new client wins, keeping overall growth broadly flat. ? CAMSRep delivered 6% YoY revenue growth, with insurer services up 5% and Bima Central growing 8%, driven by new client wins and higher user engagement.
* With respect to other non-MF businesses, CAMS Finserv recorded a 45.9% YoY growth on the back of strong product offerings. Think360’s revenue grew 36% YoY. CAMS NPS achieved 54.4% YoY/7.8% QoQ revenue growth, driven by new signings.
* Total operating expenses rose 8% YoY to INR2.1b (in line), with CIR improving to 53.7% (vs 55.3% in 4QFY25/54.1% in 3QFY26); employee costs grew 6% YoY to INR1.3b (guided ~5% ahead), while other expenses increased 10% YoY to INR868m. Having invested in the non-MF businesses for the past few years, the operating leverage is playing out in these segments.
* Other income at INR129m declined 4% YoY/remained flat QoQ vs our estimates of INR45m.
Key takeaways from the management commentary
* Costs remain well controlled, with FY26 growth at ~9% YoY, driven by structural efficiencies (automation/AI and leaner MF manpower), and FY27 expected to stay disciplined at ~5% employee cost growth and ~9% overall.
* Under CAMSRep, Bima Central doubled its active user base with 1.3m additions in FY26, maintaining ~40% market share; with LIC commencing operations in Feb’26, it is expected to meaningfully scale this segment going forward. * During the quarter, 4 SIFs launched their maiden funds, taking the total number of SIFs serviced to 6. A strong pipeline remains in place, with 8 additional SIF launches expected over the coming months
Valuation and view
* CAMS remains structurally well placed to benefit from steady MF AUM growth, supported by strong SIP momentum, while accelerating traction in high-growth non-MF segments with an increasing revenue mix shift. Profitability is gradually improving, aided by operating leverage in scalable, platform-led non-MF businesses and a disciplined cost structure. Although yields may see some compression, this is expected to be largely offset by robust non-MF growth, supporting a balanced earnings outlook.
* We have largely maintained our estimates. We expect revenue/EBITDA/PAT to post a CAGR of 13%/15%/16% over FY26-28. We reiterate a BUY rating on the stock with a revised TP of INR920 (based on 36x FY28E P/E).
For More Research Reports : Click Here
For More Motilal Oswal Securities Ltd Disclaimer
http://www.motilaloswal.com/MOSLdisclaimer/disclaimer.html
SEBI Registration number is INH000000412