Buy UTI AMC Ltd for the Target Rs. 1,250 by Motilal Oswal Financial Services Ltd
Steady SIP flows amid volatile markets
Lower-than-expected other income and higher costs led to PAT miss
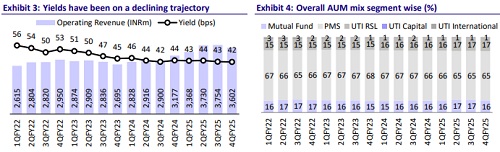
* UTI AMC’s 4QFY25 operating revenue stood at INR3.6b (in line), up 13% YoY/down 4% QoQ. For FY25, it grew 22% YoY to INR14.5b. Yield on management fees stood at 42.4bp in 4QFY25 vs. 43.7bp in 4QFY24 and 42.6bp in 3QFY25.
* Total opex was up 10% YoY/12% QoQ to INR2.1b. As bp of QAAUM, costs decreased YoY to 24.3bp from 25.8bp in 4QFY24 (vs. 21bp in 3QFY25). EBIDTA was up 18% YoY/down 20% QoQ at INR1.5b (10% miss), while EBIDTA margins stood at 42.6% vs. 41% in 4QFY24 and 50.8% in 3QFY25.
* PAT declined 44% YoY/41% QoQ to INR1b (24% miss) due to lower-thanexpected other income and higher costs. For FY25, PAT was flat YoY at INR8.1b.
* UTI AMC has witnessed a marginal yet consistent rise in monthly SIP flows throughout FY25 and anticipates this upward trend to continue.
* Equity segment yields are expected to moderate due to the telescopic TER structure; however, the recent commission rationalization is likely to cushion the impact of this dilution. We expect UTI to report a CAGR of 16%/13%/19% in AUM/revenue/core PAT over FY25-27E. The stock trades at FY26E P/E of 14x and core P/E of 22x. We reiterate our BUY rating with a one-year TP of INR1,250 (based on 23x core FY27E EPS).
Total QAAUM growth led by direct channel, while equity QAAUM growth driven by MFDs
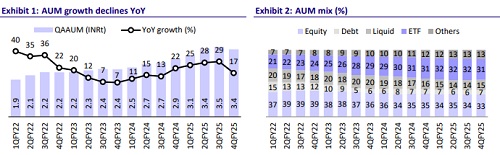
* Total MF QAAUM was up 17% YoY/down 4% QoQ at INR3.4t, driven by 7%/17%/43%/14% YoY growth in Equity/ETFs/Index/Debt funds.
* Equity QAAUM contributed 27% to the mix in 4QFY25 vs. 29% in 4QFY24. Debt/Liquid schemes contributed 7%/15% to the mix in 4QFY25 (7%/16% in 4QFY24).
* Overall net inflows for UTI were INR6.7b vs. INR43.1b in 4QFY24 and INR102.1b in 3QFY25. Equity/ETFs & Index/Income funds garnered inflows of INR15b/INR37b/INR3b, while liquid funds reported outflows of INR49b.
* Gross inflows mobilized through SIPs stood at INR22.2b in 4Q. SIP AUM stood at INR375.9b, up 22% YoY. Total live folios stood at 13.3m (as of Mar’25).
* The overall MF AAUM market share declined to 5.04% from 5.37% in Mar’24. UTI AMC’s market share in Passive/NPS AUM stood at 13.08%/ 24.86%.
* The market share in Equity/Hybrid/Index & ETFs/Cash & Arbitrage/Debt Funds stood at 3.10%/4.27%/13.08/4.32%/3.39% in Mar’25 vs. 3.68%/4.30%/13.19/4.81%/3.24% in Mar’24.
* The distribution mix in QAAUM remained largely stable in 4Q, with direct channel dominating the mix with 70% share, followed by MFDs at 22%, BND at 8%. However, with respect to equity AUM, MFDs contributed 55% to the distribution mix.
* On the product front, UTI recently secured approval for its Multi Cap Fund; no further equity launches are planned in the near term, with the product pipeline focused on ETFs and index funds.
* Total expenses grew 10% YoY/12% QoQ to INR2.1b (9% above est.), with employee costs flat YoY at INR1.2b (in-line) and other expenses up 28% YoY at INR899m (21% above est.). As a result, CIR stood at 57.4% vs. 59% in 4QFY24 and 49.2% in 3QFY25.
* Other income declined 85% YoY/65% QoQ to INR158m, mainly due to MTM impact and currency fluctuations.
* Tax rate was higher in 4QFY25, mainly due to a change in DTL (regulatory changes regarding the indexation benefit withdrawal - ~2.3% impact). Management guides it to be in the range of ~23-24%.
* The number of digital transactions during the quarter grew 25% to 4.97m, showing a strong focus on growing SIP Book digitally. Capitalizing on crossselling and upselling opportunities has supported growth in online gross sales at 95.11%.
* Total investments as of Mar’25 stood at INR40.5b, with 69%/15%/8%/8% being segregated into MFs/Offshore/Venture Funds/G-Sec/Bonds.
Growth across non-MF segments
* Total Group AUM stood at INR21.1t, up 14% YoY, of which MF AUM stood at 17%. Non-MF AUM, comprising PMS/UTI Capital//UTI RSL, grew 13%/34%/19% YoY to INR13.8t/INR26b/INR3.6t. AUM declined for UTI international by 8% YoY to INR254b.
* Yields on MF/PMS/RSL/ Capital and venture segment/International business largely remained stable sequentially.
* In the UTI International segment, the UTI India Innovation Fund, domiciled in Ireland, has AUM of USD47.02m as of Mar’25.
* UTI Pension Fund has crossed the milestone of INR3.6t AUM and manages 24.86% of the NPS Industry AUM as of Mar’25, with a market share of 24.86%.
* In the Alternatives Business, UTI AMC has gross commitments of USD200m in the IFSC GIFT City as of Mar’25
Key highlights from the management commentary
* UTI AMC is diversified across B30 and T30, with focus mainly on tier 2 and tier 3. It added 68 new branches in FY25 with zero additions costs, by rationalizing space, reallocating people and modifying branch structures.
* 59% of Equity AUM ranked in Quartiles 1 and 2 over one year, with even stronger performance over the last 3 and 6 months.
* The decline in international AUM was primarily attributed to mark-to-market (MTM) losses in the Innovation and Dynamic Equity Funds. However, management remains confident of a rebound going forward.
Valuation and view:
* Equity segment yields are expected to moderate due to the telescopic TER structure; however, the recent commission rationalization is likely to cushion the impact of this dilution.
* Improving fund performance and scaling up non-MF business will improve profitability over the medium term.
* We expect UTI to report FY25-27E AUM/revenue/Core PAT CAGR of 16%/13%/13%. The stock trades at FY26E P/E and core P/E of 14x and 22x, respectively. We reiterate our BUY rating with a one-year TP of INR1,250 (based on 23x Core FY27E EPS).
For More Research Reports : Click Here
For More Motilal Oswal Securities Ltd Disclaimer
http://www.motilaloswal.com/MOSLdisclaimer/disclaimer.html
SEBI Registration number is INH000000412