Buy Nuvama Wealth Ltd for the Target Rs. 8,600 by Motilal Oswal Financial Services Ltd

Robust performance in Private Wealth & capital market segments
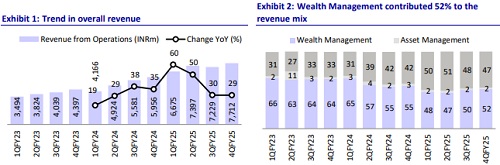
* Nuvama Wealth’s (NUVAMA) 4QFY25 operating revenue grew 30% YoY to INR7.7b (11% beat), mainly fueled by higher-than-expected revenue from Nuvama Private (20% beat) and its capital market segment (13% beat). However, the AMC revenue declined 23% YoY (27% lower than est.). For FY25, operating revenue grew 41% YoY to INR29b.
* Operating expenses grew 22% YoY to INR4.3b (12% above est.), driven by 22% YoY growth in employee expenses and 20% YoY growth in other opex. The cost-to-income ratio declined YoY to 56.4% in 4QFY25 vs. 60% in 4QFY24 (our est. of 56.1%).
* PAT grew 41% YoY to INR2.6b (15% beat) in 4QFY25. For FY25, PAT rose 65% YoY to INR9.9b.
* In the wealth segment, the focus remains on expanding the MPIS book, which contributes ~70% to overall net new money flows. In the private wealth business, the emphasis is on scaling the ARR book, which currently accounts for ~60% of the segment's revenue.
* We raise our FY26E/27E earnings by 9%/14% as we increase our yield estimates for Nuvama’s wealth and custody businesses to factor in the recent strength in performance. We also raise our cost-to-income ratio estimates for the wealth segments as the company continues to invest in capacity creation in both the wealth management segments. We expect an 18%/19% revenue/PAT CAGR for FY25-27. Reiterate BUY with a TP of INR8,600 (premised on 22x FY27E).
MPIS (Nuvama Wealth) and ARR (Nuvama Private) key growth drivers
* Nuvama Wealth
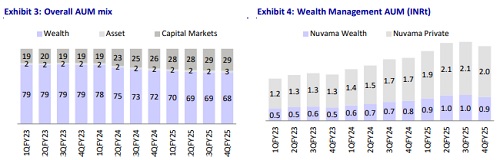
* Revenue rose 17% YoY (6% beat) to INR2.15b in 4QFY25, driven by 50% YoY growth in Managed Products and Investment Solutions (MIPS), while the NII grew 9% YoY and brokerage income declined 36% YoY in 4QFY25. The average client assets grew 22% YoY to INR947b.
* It reported a decline of 55% YoY in net new flows, reaching INR6.3b in 4QFY25, with MPIS net new money reaching INR13.6b (down 8% YoY).
* The CIR ratio increased to 69.2% in 4QFY25 from 68.3% in 4QFY24. Adjusting for costs and revenues related to recent capacity hirings, the cost-to-income ratio would have seen an improvement of ~250–300bp.
* Retention declined YoY to 92bp from 94bp in 4QFY24.
* Nuvama Private
* Total revenue surged 24% YoY in 4QFY25 (20% beat) to INR1.8b, primarily driven by a 33% YoY growth in transactional income.
* This growth in transactional revenue was supported by heightened activity in unlisted shares and fixed-income products.
* The average client assets grew by 16% YoY to INR1.98t. The ARR and transactional assets net new flows remained strong at INR19.9b, up 55% YoY in 4QFY25.
* The CIR ratio increased to 66.1% in 4QFY25 from 62.5% in 4QFY24. Adjusting for costs and revenues related to recent capacity hirings, the cost-to-income ratio would have seen an improvement of ~250–300bp.
* Revenue from managed products and NII grew 23%/18% YoY, while revenue from advisory declined 14% YoY.
* Retention declined to 87bp in 4QFY25 from 99bp in 4QFY24.
* Nuvama AMC
* Revenue declined 23% YoY (27% miss) to INR132m in 4QFY25, mainly due to a 25% YoY dip in private markets and a 9% YoY dip in carried interest income.
* The average fee-paying AUM (~92% of total AUM is fee-generating) jumped 89% YoY to INR100.9b, mainly driven by 172% growth in public markets AUM, while the net new money declined 43% YoY in 4QFY25.
* Nuvama Capital Markets
* Total revenue grew 46% YoY (13% beat), with revenue from asset services/ IE&IB growing 85%/16% YoY. Nuvama sustains market share in IE and IB deal pipeline continues to remain strong.
* The average client assets in the asset services segment grew 40% YoY to INR1.2t, driven by 53% YoY growth in assets under custody.
* The retentions on average assets under clearing improved to 2% vs. 1.3% in 4Q.
* Revenue from wealth management contributed 52% to the revenue mix, followed by Capital Markets and Asset Services (47%), and Asset Management (2%).
* Employee expenses grew 22% YoY to INR3.1b (with fixed costs up 22% YoY mainly due to 350 new RM hirings), while other opex grew 20% YoY to INR1.3b, mainly due to a few one-offs and seasonal events like offsites and the flagship IE event. The CIR for 4QFY25 improved to 56% in 4QFY25 from 60% in 4QFY24.
* Technology-related expenses are projected to remain elevated due to the integration of GEN AI into core systems
Highlights from the management commentary
* Under the Private Wealth business, the operations in Dubai are now fully functional and have reached operational break-even. Plans are underway to expand capacity, and the company has received final regulatory approval to commence operations in Singapore.
* Under the institutional business, market share in the IE segment continues to expand. If market conditions remain favorable, this momentum is expected to support a strong pipeline and mandate generation in the IB segment. ~30–35 IPO mandates have already been signed, along with 10–15 advisory mandates.
Valuation and view
We raise our FY26E/27E earnings by 9%/14% as we increase our yield estimates for Nuvama’s wealth and custody businesses to factor in the recent strength in performance. We also raise our cost-to-income ratio estimates for the wealth segments as the company continues to invest in capacity creation in both the wealth management segments. We expect an 18%/19% revenue/PAT CAGR for FY25-27. Reiterate BUY with a TP of INR8,600 (premised on 22x FY27E).
For More Research Reports : Click Here
For More Motilal Oswal Securities Ltd Disclaimer
http://www.motilaloswal.com/MOSLdisclaimer/disclaimer.html
SEBI Registration number is INH000000412