Buy Apl Apollo Tubes Ltd For Target Rs.2,260 by Motilal Oswal Financial Services Ltd
At inflection point with increasing capacity and improving demand APL Apollo Tubes (APAT) is India's undisputed market leader in structural steel tubes with a 55% market share and 4.5 MTPA capacity spread across 11 manufacturing facilities. It has delivered consistent volume growth in the last eight quarters, with sales rising to a record ~917KT in 3QFY26 (+11% YoY). In 3Q, HRC prices have declined by 4% QoQ and 8% vs. 1Q, though they have increased 8% in the last 20 days after the imposition of safeguard duty on steel imports. HRC price drop in 3Q could lead to inventory losses, and consequently, we have projected EBITDA/MT of INR5,000 for 3Q vs. INR5,228 in 2Q.
- Despite persistent softness in the industry, APAT registered 11% YoY volume growth in 9MFY26 and maintains FY26 volume growth guidance of 10-15%, supported by capacity expansion in the high-growth region (Dubai), new strategy of launching a sub-premium brand ‘SG Premium’ and healthy private-sector demand across infrastructure, solar, and manufacturing.
- APAT plans to incur a capex of INR15b – fully internally funded – to scale up its capacity from 4.5 MTPA in Sep’25 to 6.8 MTPA by FY28 and 10 MTPA by FY30 through ~1.0 MTPA greenfield and ~0.8 MTPA brownfield additions across India and Dubai, including specialty tubes. New plants address regional gaps, while Dubai and Bhuj SEZ-led exports boost international volumes above 1 MTPA (20% of sales) in the long term, structurally improving realizations and margins.
- India’s 500 GW renewable target by 2030 unlocks an ~830 KT opportunity in solar mounting structures. APAT targets a 15% share (~125 KT), translating into INR3- 5b incremental revenue from solar mounting structures, supported by superior tube economics, premium pricing (INR5,000-6,000/MT), and plant proximity to solar-rich states.
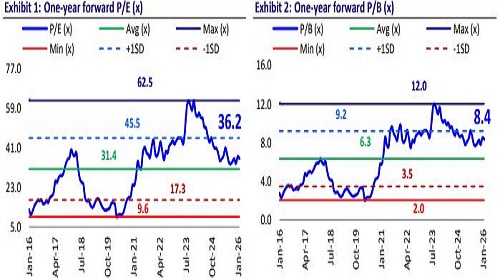
- We expect APAT to report a CAGR of 14%/29%/33% in revenue/EBITDA/PAT over FY25-28. We value the stock at 35x FY27E EPS to arrive at our TP of INR2,260. Reiterate BUY.
Improving demand supported by rising prices
- APAT’s sales volumes have been increasing for the last eight quarters, and are up from 679,000 MT in 4QFY25 to a record 916,976 MT in 3QFY26 (up 11% YoY), confirming market share consolidation amid broader industry demand expansion.
- Despite having scaled up much higher than its peers, APAT has outperformed them in recent quarters. APAT delivered 13% volume growth in 2Q vs. 7%/2% growth for HariOm Pipes/Hi-tech and a 21% fall for JTL. The outperformance continued in 3Q, with 11% growth for APAT vs. 10% growth for HiTech and a 7% decline for JTL.
- Management has guided for FY26 volume growth of 10-15% YoY, while we have built in 11% YoY growth (~3,500KTPA) considering 9MFY26 volumes.
- Demand for structural tubes has been slowing over the last few quarters due to extended monsoon, subdued domestic demand and declining HRC prices. However, volume growth for the company has remained healthy (in low double digits), largely led by capacity expansions and faster ramp-up of its Dubai plant (over 90% utilization in 3Q vs. 80% in 2Q).
- HRC prices have declined by 11% to INR47,514/MT as of 15th Dec’25 from the May’25 high of INR53,289/MT on the back of weak demand and higher global supply. However, with the recent implementation of 12% safeguard duty on steel imports, HRC prices have increased 8% in the last 20 days to INR51,536/MT. The uptrend in prices, if continued, would drive margin expansion for APAT.
- Despite falling HRC prices, demand in 3Q was better than the previous quarters, primarily led by private players across end-user applications such as commercial infra, data centers, solar modules, and other manufacturing sectors. This demand improvement could drive up the company’s volume growth.
Unorthodox strategy to gain market share
- APAT has also implemented a new strategy recently to penetrate the market further and gain market share from secondary/unorganized players.
- It is launched a new sub-premium brand, ‘SG premium’, which is being sold at a competitive rate in the market and ~INR3-3.5/kg lower than flagship APL Apollo brand. This will have some cannibalizing impact but will help the company gain market share.
- As per management, SG Premium was introduced as a tactical flank to compete in lower-price bands without diluting APL Apollo. EBITDA is intentionally thin under this brand, i.e., almost nil or maybe in the range of +/- INR500/MT.
- Rationale for launching this brand is to prevent dealers from sourcing nonApollo alternatives and absorb spare capacity/cost leverage.
Consistently adding capacity to stay ahead of its peers
- APAT has been the market leader in India's structural steel tube industry with an estimated market share of 55%, operating 11 manufacturing facilities across India and one in Dubai with an aggregate capacity of 4.5 MTPA as of Sep’25.
- The company has been consistently adding capacities to stay ahead of its peers, cover more demand markets and introduce new value-added products (VAP). The company’s capacity increased at ~14% CAGR over last decade to ~4.5M MT as of Sept’25.
- The company's operational footprint spans Sikandrabad (3 units, 1.35 MTPA), Raipur (2 units, 1.2 MTPA including the recently commissioned high-margin facility), Hosur (0.65 MTPA, equipped with Direct Forming Technology for large sections), and smaller operations in Malur, Bengaluru, Hyderabad, Murbad, and Dubai.
- This geographic dispersion, while creating operational complexity, provides natural hedges against regional demand cyclicality and enables market-specific product customization.
- The company is executing an aggressive capacity expansion program targeting 6.8 MTPA by FY28 and 10 MTPA by FY30 for a capex of INR15b over the next three years (entirely from internal accruals).
- The capex will be incurred for the addition of ~1m MT of greenfield across Gorakhpur (0.2m MT), Kolkata (0.3mMT), Bhuj (0.3m MT) and New Malur, Karnataka (0.36m MT) and 0.8m MT brownfield capacity in Dubai (~0.2m MT) and Raipur (0.6m MT). A part of this capex will be utilized for the addition of a new segment, Specialty Tubes, which will be used in applications such as Structural/Oil & gas /Water/ Mechanical sectors.
Addressing geographic gaps, building export revenue and better mix
- These additions address critical geographic gaps, where APAT currently has limited presence. Gorakhpur's proximity to existing operations provides supply chain advantages, while Kolkata penetrates the nascent Northeast market, where structural tubes remain an emerging category.
- The company focuses on boosting its export revenue share, which is characterized by higher margins, strong demand and bigger market opportunity. The company’s Dubai facility with ~0.3m MT capacity has achieved utilization of over 90% in 3Q vs. ~80-85% in 2Q. Another 0.2m MT capacity is becoming operational in 4QFY26 and is expected to ramp up quickly. Bhuj's special economic zone location enables export-competitive pricing for the Middle Eastern and African markets. In the longer run, the company expects its international sales to surpass 1 MMT (~0.5 MMT from the Dubai plant and 0.5 MMT of exports from India), accounting for ~20% of total sales volume.
- The brownfield expansions at Raipur (600 KT) and Dubai (200 KT) are aimed at profitable margin expansion rather than volume growth.
- Raipur's existing 100% roofing sheets utilization supports 500 KT incremental roofing expansion at INR5,500-6,000/MT EBITDA (premium to company average), while 100 KT heavy-structure expansion targets the emerging infrastructure opportunity in railway stations and airport terminals. .
- Dubai's 200KT brownfield expansion aims to achieve 100% capacity utilization and capture the INR7,000-8,000/MT EBITDA opportunity in premium international specifications, representing higher-margin advantage over commodity export realization.
- The specialty tubes initiative (0.5m MTPA by FY30) represents the company's strategic shift, directly addressing the automotive, oil & gas, and water infrastructure segments historically dominated by specialized manufacturers. Seamless and API pipe segments command INR6,000-8,000/MT EBITDA.
New-age applications align with the ambitions of APAT and India
- India's renewable energy ambitions, targeting 500 GW installed capacity by 2030 (from 234GW as of Aug’25), create a structural demand driver for solar mounting structures (MMS) utilizing structural steel tubes as primary input.
- APAT has identified this as its emerging opportunity, estimating an addressable market of 830,000 MT by 2030 across three application categories: residential rooftop (360,000 MT, driven by 14.5GW residential capacity addition) and ground-mounted systems (350,000 MT, for 14.2GW still structures; 120,000 MT, for 4.6GW Trackers). APAT’s strategy targets capturing 15% market share of the 830,000MT opportunity (125,000MT), implying INR3-5b incremental revenue opportunity by 2030.
- Structural steel tubes represent the optimal solution for solar mounting structures, combining cost-effectiveness with superior engineering economics vs. traditional construction materials. Their capital intensity and standardization enable semi-automated manufacturing, supporting premium pricing of INR5,000-6,000/MT for galvanized/coated variants (versus INR3,500/MT commodity tubes), justified by 25+ year durability requirements.
- These tubes deliver higher strength-to-weight ratios, enabling faster construction timelines while reducing overall project costs by 15-20%. Ecofriendly credentials stem from recyclability and lower lifecycle emissions compared to concrete/aluminum alternatives.
- Geographic concentration in solar-rich states (Gujarat, Rajasthan, AP, Tamil Nadu) perfectly aligns with APAT’s Bhuj and South India manufacturing hubs minimizing distribution costs and enabling regionally optimized supply chains for India's 500 GW renewable energy target.
Valuation and view
- APAT is India's most compelling structural steel tube operator with commanding market dominance (55% share), strong balance sheet (net cash), and strategic clarity on capacity expansion and product mix improvement. The company's systematic approach to margin expansion, driven by VAP mix improvement toward 70%, cost optimization, and geographic diversification through greenfield plants, positions it to achieve EBITDA/ton of INR5,000+ and RoCE of more than 30% by FY28.
- The emerging opportunity landscape is equally compelling – solar mounting structures present an 830,000-ton market opportunity by 2030. Specialty tubes for automotive, oil & gas, and water infrastructure segments open up highmargin revenue pools for APAT, historically untapped by commodity tube manufacturers.
- With HRC prices reversing supported by improving demand, FY26 volume growth guidance demonstrates management's operational execution. The convergence of structural market tailwinds, execution risk mitigation through a proven supply chain, and financial capacity to fund INR15b expansion from internal accruals suggests the company is well-positioned to double its capacity over the FY26-30 period.
- We expect APAT to report a CAGR of 14%/29%/33% in revenue/EBITDA/PAT over FY25-28. We value the stock at 35x FY27E EPS to arrive at our TP of INR2,260. Reiterate BUY
For More Research Reports : Click Here
For More Motilal Oswal Securities Ltd Disclaimer
http://www.motilaloswal.com/MOSLdisclaimer/disclaimer.html
SEBI Registration number is INH000000412