Neutral Vedant Fashions Ltd for the Target Rs. 725 by Motilal Oswal Financial Services Ltd

Growth pangs continue; all hopes pinned on stronger 2H
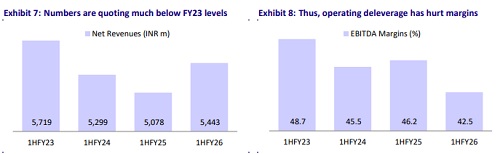
* Vedant Fashion’s (VFL) 2Q performance was impacted by GST-linked dispatch disruptions, creating a ~6% delta between primary and secondary sales. However, the company has been struggling to revive growth sustainably, with its 1HFY26 revenue tracking 5% below 1HFY23 levels.
* Margins contracted ~270bp/340bp YoY at the gross/EBITDA level, reflecting a lower wedding mix and continued operating deleverage.
* VFL continued to consolidate its retail footprint in order to improve overall quality. The company closed eight net domestic EBOs and seven SIS for a net closure of 13 stores during 2Q. Management indicated that further store consolidation is likely in 2HFY26.
* We cut our FY26-27E earnings estimates by 5-8% due to lower gross margins and operating deleverage. We build in 7%/6%/5% Revenue/EBITDA/PAT over FY25-28E.
* Following a sharp correction (VFL: -50% YTD), the stock now trades at ~38x FY27E EPS (~40% below its LT average). While valuations have moderated, we await evidence of sustainable growth rebounding for VFL before we turn constructive. Reiterate Neutral with a revised TP of INR725 (earlier INR785), premised on 40x Dec’27E P/E.
Another weak quarter; revenue/EBITDA declines 2%/9% YoY
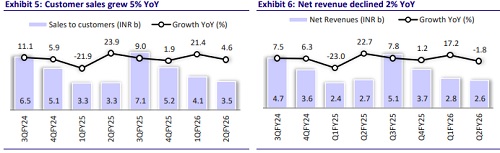
* Customer sales grew 4.6% YoY to INR3.5b, driven largely by ~5% YoY store additions as SSS declined 2% YoY.
* Consolidated 2Q revenue declined 2% YoY to INR2.6b (weaker vs. our estimate of +1% YoY) due to low wedding days and the transitory impact of the GST implementation.
* VFL closed net 13 stores (net closure of eight domestic EBOs and seven SIS offset by two EBO additions internationally). However, net area inched up 3.5k sqft QoQ to 1.79m sqft (up 5% YoY).
* Gross profit (GP) declined 7% YoY to INR1.9b, as gross margin contracted 375bp YoY to 71.6% (355bp miss). Including job work charges, GP declined ~6% YoY, with margins contracting ~270bp YoY.
* Employee cost increased 14% YoY (8% higher), while other expenses declined ~7% YoY (10% lower).
* EBITDA declined ~9% YoY to INR1.1b (8% miss), driven by weaker revenue growth and lower gross margin.
* EBITDA margin contracted ~340bp YoY to 42.1% (~220bp miss).
* Pre-IND AS EBITDA for 1HFY26 came in at INR1.39b (down 8% YoY), with margins at 25.5% (down 420bp YoY).
* Depreciation/finance cost rose 12%/9% YoY, while other income rose ~3% YoY.
* As a result, reported PAT declined ~16% YoY to INR0.56b (14% miss).
* For 1HFY26, revenue grew at a modest 7% YoY (on a low base), but remained ~5% below 1HFY23 levels, while EBITDA/PAT declined 1%/2% YoY.
* Based on our estimates, the implied growth rate for revenue/EBITDA/PAT in 2HFY26 stands at 6%/5%/4%.
* OCF (post interest and leases) stood at INR186m (vs. INR55m outflow YoY), driven by favorable WC movement. FCF (post interest and leases) came in at INR74m (vs. INR77m outflow YoY).
* Overall WC capital days declined to 201 (vs. 247 YoY), led by a sharp decline in receivable days to 158 (vs. 220 YoY), partly offset by lower payable days at 20 (vs. 35 YoY). Inventory days were broadly steady YoY at ~63.
Highlights from the management commentary
* Demand: VFL’s primary sales were adversely impacted by the GST transition during 2Q, due to disruptions in dispatches for 15-20 days. This led to ~6pp delta between reported and customer sales.
* Pricing post GST 2.0: For VFL, most of its products are priced upwards of INR2,500, where GST rates have increased from 12% to 18%. The company took calibrated pricing actions with selective pass-throughs, partial price absorption, and tactical markdowns. Management expects improvement in broader consumer sentiment, with GST rationalization at the lower end to aid demand.
* Regional trends: After a slump in FY25, AP and Telangana markets have rebounded sharply in 1HFY26, with 20%+ growth.
* SSSG: Management targets for ~8-9% SSSG in the medium to long term, driven by an ASP increase (~2.5–3%), a change in the brand mix (~0.5–0.6%), and a focus on footfall recovery and repeat behavior to unlock volume leverage.
* Store additions: Management continues to focus on improving the quality of retail footprint, which is likely to result in the continuation of store consolidation in the near term.
Valuation and view
* Over the past few years, VFL has experienced sales stagnation, driven by a high base (COVID bump in FY23), weaker wedding calendar, and subdued overall consumer sentiment. However, we believe that rising competition and slowerthan-expected shift from unorganized to organized in the ethnic wear category have also been the key headwinds for VFL.
* Growth recovery in Manyavar (on a low base over the past few years), the scaleup of Mohey (women’s celebration wear), and Twamev (premium offering in celebration wear), along with improved traction from recent forays into newer categories (Diwas, value brand catering to festive wear) remain the key growth drivers.
* VFL’s focus on boosting SSSG and improving the retail area quality is a positive development and remains key for the re-rating of the stock.
* We cut our FY26-27E earnings estimates by 5-8% due to lower gross margins and operating deleverage. We build in 7%/6%/5% Revenue/EBITDA/PAT over FY25-28E.
* Following a sharp correction (VFL: -50% YTD), the stock now trades at ~38x FY27E EPS (~40% below its LT average). While valuations have moderated, we await evidence of sustainable growth rebounding for VFL before we turn constructive. Reiterate Neutral with a revised TP of INR725 (earlier INR785), premised on 40x Dec’27E P/E.
For More Research Reports : Click Here
For More Motilal Oswal Securities Ltd Disclaimer
http://www.motilaloswal.com/MOSLdisclaimer/disclaimer.html
SEBI Registration number is INH000000412