Neutral The Ramco Cements Ltd for the Target Rs. 1,060 by Motilal Oswal Financial Services Ltd
Higher volume drives EBITDA beat
Reiterates capacity target of 30mtpa by Mar’26
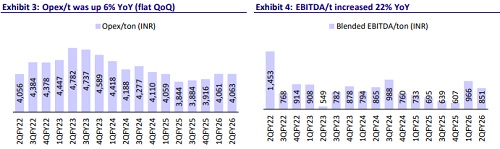
* The Ramco Cements’ (TRCL) 2QFY26 EBITDA grew 24% YoY to INR3.9b (12% beat), led by higher-than-estimated volume (5% beat) and lower-thanestimated opex/t. EBITDA/t rose 22% YoY (down 12% QoQ) to INR851 (6% beat). Adj PAT surged 191% YoY to INR743m (55% beat), albeit on a low base.
* Management indicated that muted volume growth was due to early monsoons, excess rainfall, and run-up to GST 2.0. The construction chemicals business, however, registered strong performance, with sales volume up ~72% YoY on a low base. TRCL has reiterated its target to reach 30mtpa cement capacity by Mar’26 through the commissioning of the line II at Kolimigundla and debottlenecking/grinding capacity additions at existing sites with minimal capex. It has monetized non-core assets worth INR5b out of the targeted value of INR10b. The balance is yet to be monetized, subject to necessary approvals.
* We maintain our EBITDA estimates for FY26-28. The stock is currently trading at 14x/12x FY27E/FY28E EV/EBITDA. We value the stock at 13x Sep’27E EV/EBITDA to arrive at our TP of INR1,060. Reiterate Neutral.
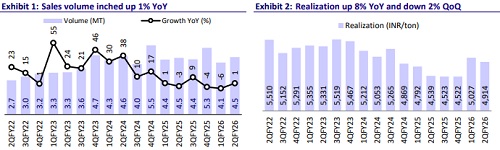
Overall volume increased ~1% YoY; realization/t up 8% YoY
* Revenue/EBITDA/adj. PAT stood at INR22.3b/INR3.9b/INR743m (+10%/+ 24%/+191% YoY and +6%/+12%/+55% vs. estimates) in 2Q. Sales volume inched up ~1% YoY to 4.5mt (~5% beat). Realization/t was up 8% YoY/down ~2% QoQ at INR4,914/t (in line).
* Opex/t was up 6% YoY (1% below our estimate), led by 5%/14%/3% increase in variable cost/other expenses/freight cost. OPM surged 2pp YoY to ~17% (vs. estimate of ~16%), and EBITDA/t increased ~22% YoY to INR851.
* Depreciation increased ~8% YoY, while interest cost declined 7% YoY. Other income declined ~38% YoY. ETR stood at 25.9% vs. 26.9% in 2QFY25.
* In 1HFY26, revenue/EBITDA/adj. PAT stood at INR43.1b/INR7.8b/INR1.6b (up ~4%/24%/162% YoY). OPM surged 2.9pp YoY to ~18.2%. OCF stood at INR6.5b vs. INR4.4b in 1HFY25. Capex stood at INR6b vs. INR5.4b. Net cash inflow stood at INR451m vs. INR1b in 1HFY25.
Highlights from the management commentary
* The share of premium products was ~30% in 2QFY26 vs. ~27%/29% in 2QFY25/1QFY26 in the south region. In the east region, it was ~24% in 2QFY26 vs. ~23%/22% in 2QFY25/1QFY26. OPC share was ~35% of total volumes in 2QFY26 vs. 30%/31% in 2QFY25/1QFY26.
* Blended coal consumption cost was USD122/t (INR1.49/kcal) vs. USD130/ USD126 (INR1.60/INR1.55 per kcal) in 2QFY25/1QFY26.
* In 2Q, TRCL incurred capex of INR2.8b, including maintenance capex. FY26 capex guidance is INR12b.
View and valuation
* TRCL’s operating performance was above our estimates due to higher-thanestimated volume and lower opex/t. We estimate a CAGR of ~9%/24% in revenue/EBITDA over FY25-28 and ~107% in PAT (on a low base). We believe that net debt peaked in FY25 at INR44.3b (net debt-to-EBITDA at 3.6). We estimate its net debt to decline to INR36.6b (net debt-to-EBITDA at 1.6x) by FY28.
* The stock is currently trading at 14x/12x FY26E/FY27E/FY28E EV/EBITDA (vs. its long-term average of 15x) and USD110/108 EV/t (vs. long-term average of USD130). We value the stock at 13x Sep’27E EV/EBITDA to arrive at our TP of INR1,060. Reiterate Neutral.
For More Research Reports : Click Here
For More Motilal Oswal Securities Ltd Disclaimer
http://www.motilaloswal.com/MOSLdisclaimer/disclaimer.html
SEBI Registration number is INH000000412