Buy UTI AMC Ltd for the Target Rs. 1,270 by Motilal Oswal Financial Services Ltd

Elevated operating expenses lead to an EBITDA miss… …while the negative other income affects PAT
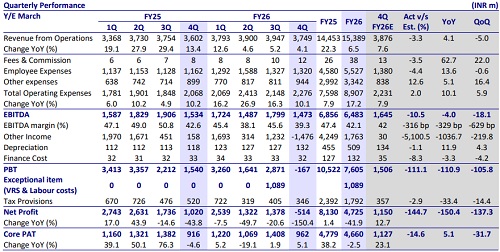
* UTI AMC’s revenue from operations came in at INR 3.7b (in line), reflecting a growth of 4% YoY, but it declined 5% QoQ. Yield on management fees was 38.6bp in 4QFY26 vs. 42.4bp in 4QFY25 and 40.1bp in 3QFY26. For FY26, it came in at INR15.4b, up 7% YoY.
* Total opex came in at INR2.3b, registering a growth of 10% YoY/6% QoQ. As a bp of QAAUM, opex stood at 23.4bp in 4QFY26 (vs. 24.3bp in 4QFY25). EBITDA was INR1.5b in 4QFY26 (11% miss due to higher other expenses). EBITDA margin came in at 39.3% vs. 42.6% in 4QFY25 and 45.6% in 3QFY26.
* PAT stood at negative INR514m in 4QFY26 vs. our est. of INR1.2b. For FY26, PAT came in at INR5.8b, up 61% YoY.
* Regarding the TER regulations effective Apr’26, management indicated to fully pass on the impact to distributors, resulting in no material impact on the company’s P&L. However, the company anticipates a 1-2bp compression in yields, primarily due to an increasing mix of passive products and a tilt toward lower-duration debt funds.
* Despite an AUM decline driven by current trends, the impact on revenue is partially offset by lower employee costs, resulting in an increase in core EPS for FY27 and broadly stable earnings for FY28. We reiterate our BUY rating with a one-year TP of INR1,270, based on 24x FY28E core EPS.
MF yields continue to dip
* Overall MF QAAUM grew 14% YoY but flat QoQ at INR3.9t. Equity/Hybrid/ ETFs/Index/Debt funds experienced a YoY growth of 5%/31%/25%/25%/3%.
* Equity QAAUM contributed 32% to the mix in 4QFY26 vs. 33% in 4QFY25. Debt/liquid schemes contributed 6%/14% to the mix in 4QFY26 (7%/15% in 4QFY25). ETFs/Index contributed 34%/11% to the mix (31%/10% in 4QFY25).
* The MF segment’s yield dipped to 31bp (from 34bp in 4QFY25), as the contribution from equity declined. Overall net inflows for UTI were negative INR4.5b vs. positive flows of INR6.7b in 4QFY25 and INR58.6b in 3QFY26.
* Equity/Liquid/Income outflows for the quarter were INR1.3b/INR67b /INR36b, while ETFs & Index schemes garnered inflows of INR100b.
* Gross inflows mobilized through SIPs stood at INR24.6b in 4QFY26, with the SIP AUM increasing to INR398.1b (+6% YoY). Live folios remained stable sequentially at 13.8m as of the end of Mar’26.
* The overall MF AAUM market share declined to 6.5% from 7.4% in Mar’25. UTI AMC’s market share in Passive/NPS AUM was largely stable at 12%/24%. The market share in Equity/Hybrid/Cash & Arbitrage/Debt Funds stood at 3%/ 4%/4%/3% in Mar’26.
* The distribution mix in QAAUM remained largely stable in 4Q, with the direct channel dominating the mix at 73%, followed by MFDs at 20% and BND at 7% share. However, with respect to equity AUM, MFDs contributed 52% to the distribution mix.
* As a bp of QAAUM, the cost increased QoQ to 23.4bp in 4QFY26 (vs. 21.8p in 3QFY26), and the cost-to-income ratio increased sequentially to 60.7% (from 54.4% in 3QFY26). Employee costs grew 14% YoY to INR1.3b. For FY27, the employee cost run rate is likely to be at INR1.25b–1.3b per quarter on a consolidated basis. Other expenses grew 5% YoY to INR944m and are guided to grow at ~10% consolidated going forward.
* Other income was at negative INR1.5b in 4QFY26, led by MTM losses. Total investments as of Mar’26 remained steady at INR39.9b, with 72%/14%/6%/8% being segregated into MFs/Offshore/Venture Funds/G-Sec/Bonds.
* The number of digital transactions during the quarter grew 23% YoY to 6.1m, while online gross sales were at ~89.5%.
Yields improve in the UTI International and UTI Capital segments
* Total Group AUM stood at INR23.4t, up 11% YoY, of which MF AUM stood at INR3.9t, up 14% YoY. Non-MF AUM grew 11% YoY to INR19.5t, with PMS AUM growing 11% YoY to INR15.3t. UTI Capital grew 38% YoY to INR36b, and UTI Pension AUM grew 12% YoY to INR4t. UTI International AUM declined 35% YoY to INR165b.
* Yields on PMS and Pension businesses largely remained stable YoY, while yields improved YoY for International/Capital businesses to 66bp/88bp.
Key takeaways from the management commentary
* Equity net flows have been improving toward breakeven after earlier negative trends. SIP growth and multi-product distribution are key levers to improve net equity inflows.
* Digital initiatives led to a 2.3% revenue increase, 33% rise in transactions, and 31% reduction in cost per transaction.
* On the international business front, the company’s performance was hit by global outflows. The strategy remains to diversify into alternatives and wait for a cyclical recovery in the global sentiment.
Valuation and view
* The core AMC operations of UTI AMC have experienced consistent growth in AUM, supported by a diversified product mix, with a strong tilt toward equity, healthy SIP inflows, and robust retail traction.
* Going forward, improving the performance of equity schemes will be key for a rise in contributions from equity schemes, resulting in yield improvement. Despite an AUM decline driven by current trends, the impact on revenue is partially offset by lower employee costs, resulting in an increase in core EPS for FY27 and broadly stable earnings for FY28. We reiterate our BUY rating with a one-year TP of INR1,270, based on 24x FY28E core EPS.
For More Motilal Oswal Securities Ltd Disclaimer
http://www.motilaloswal.com/MOSLdisclaimer/disclaimer.html
SEBI Registration number is INH000000412







.jpg)