Buy Fusion Finance Ltd for the Target Rs. 215 by Motilal Oswal Financial Services Ltd

Moves closer to profitability; business momentum to improve
GS3 improves ~80bp QoQ; sustained sequential decline in credit costs
* Fusion Finance (FUSION) reported a net loss of ~INR221m in 2QFY26 (vs. est. profit of INR7m). NII in 2QFY26 declined ~38% YoY to ~INR2.5b (7% miss). Opex rose 9% YoY to INR2.1b (flat QoQ; in line) and the cost-toincome ratio declined ~60bp QoQ to ~70.2% (PQ: ~70.8% and PY: ~40.4%). PPoP declined ~69% YoY to ~INR890m (11% miss).
* Net credit costs declined sequentially to ~INR1.1b (vs. est. of ~INR1b). Annualized credit costs in 2QFY26 stood at ~6.4% (PQ: 9.4% and PY: 26%).
* Management highlighted that the new portfolio continues to perform well, reflecting the strength of the revised underwriting framework and improved collection practices. In 2QFY26, collection efficiency on the new book was 99.5%, and overall collection efficiency also improved during the quarter. The company has guided for normalized credit costs of ~3.5% from FY27 onwards. We model credit costs of 5.9%/3.5% in FY26/FY27E.
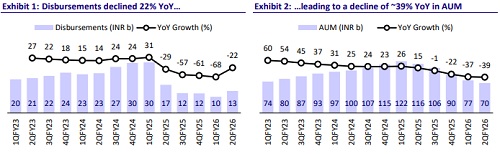
* Disbursements grew 37% QoQ to ~INR13b. AUM declined ~39% YOY and 9% QoQ to ~INR70b. Management indicated that Fusion’s business has largely stabilized and is now well-positioned to exhibit net positive growth in its AUM by the end of 3Q or early 4QFY26.
* We cut our FY26 EPS estimate and now project a net loss in FY26 vs. our earlier expectation of a marginal profit. We also cut our FY27 EPS estimates by ~12% to factor in slightly higher opex and credit costs. We estimate an AUM CAGR of ~7% and a PPOP CAGR of ~2% over FY25-28, along with an RoA/RoE of ~4.2%/13.8% in FY28E.
* Fusion has taken meaningful steps to strengthen its operating model, including sharper underwriting filters, improved collection efficiency, and technological enhancements that support productivity and asset quality. These measures have set the foundation for sustainable growth and a return to profitability from 3QFY26 onwards.
* At the current valuation of 1x FY27E BV, the stock offers an attractive entry point, factoring in much of the past stress but not fully reflecting the medium-term recovery potential. We reiterate our BUY rating on the stock with a revised TP of INR215 (based on 1.2x Sep’27E P/BV).
GS3 improves ~80bp QoQ; collection efficiency rises
* FUSION’s GS3 improved ~80bp QoQ to ~4.6%, while NS3 rose ~20bp QoQ to 0.4%. Stage 3 PCR stood at 92% in 2QFY26.
* Stage 2 declined ~25bp QoQ to 2.2% and S2 PCR declined ~160bp QoQ to ~70%. ECL/EAD (incl. management overlay of ~INR455m) declined to ~7% (PQ: ~8.2%). Write-offs for the quarter declined to ~INR2.5b (PQ: INR4.9b). Management shared that the current portfolio collection efficiency (CE) stood at ~98.5% in 2QFY26.
* FUSION’s annualized credit costs in 2QFY26 stood at ~6.4% (PY: ~26% and PQ: ~9.4%). We model credit costs of 6%/3.5% for FY26/FY27.
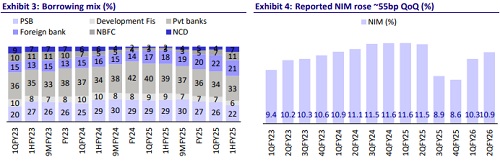
Reported NIM expands ~55bp QoQ; calculated yields rise ~50bp QoQ
* Yields (calc.) rose ~50bp QoQ to ~22.7%, while CoF (calc.) increased ~30bp QoQ to ~10.5%, leading to a ~20bp QoQ rise in spreads to ~12.2%. Reported NIMs rose ~55bp QoQ to ~10.9%, supported by lower income reversals.
* Marginal CoB declined ~40bp QoQ to ~13.3%. Fusion shared that it aims to broadly maintain the NIMs at current levels. We model (calc.) NIM (as a % of gross loans) of 13.9%/14.7% in FY26/FY27.
* The share of public sector banks in the borrowing mix dipped ~4pp to ~22% in 2QFY26 (PQ: 26%). FUSION had a robust liquidity of ~INR8.9b, an aggregate of cash and cash equivalents and liquid assets, amounting to ~13% of the total assets.
Active borrower base declines; reduction in Fusion+>=3 customers
* The borrower base declined to 2.6m as of Sep'25 (down from 2.8m as of Jun'25). FUSION’s + >=3 borrowers declined to 13.9% (vs. ~17.6% in Jun’25), and it only onboards customers if they are in the current bucket for all their MFI loans.
* FUSION’s CRAR stood at ~31.3% as of Sep’25.
Highlights from the management commentary
* Management indicated that recoveries are improving across both pre-write-off and written-off pools, and it expects write-back trends to strengthen over the next 2-3 quarters.
* Fusion shared that it released ~INR150m of management overlay during the quarter, which was driven by earlier over-provisioning alongside improving collection efficiency. The company also indicated that it will continue to utilize/release the management overlay gradually over the next few quarters.
* Management reiterated that strengthening the capital position remains a core priority for supporting the next phase of growth. The next tranche of the Rights issue (~INR4bn) has been called, reflecting confidence in the business trajectory, collection efficiency, and recoveries.
Valuation and view
* Fusion reported a relatively soft quarter with AUM continuing to contract; however, the company moved closer to profitability, driven by a further decline in credit costs. Disbursements improved during the quarter, and the company continues to ramp up volumes while maintaining a cautious underwriting stance, which is evident in stable PAR trends and strong collection efficiency. Margins also strengthened, aided by lower interest income reversals.
* At the current valuation of 1x FY27E BV, the stock offers an attractive entry point, factoring in much of the past stress but not fully reflecting the mediumterm recovery potential. We reiterate our BUY rating on the stock with a revised TP of INR215 (based on 1.2x Sep’27E P/BV).
For More Research Reports : Click Here
For More Motilal Oswal Securities Ltd Disclaimer
http://www.motilaloswal.com/MOSLdisclaimer/disclaimer.html
SEBI Registration number is INH000000412