Buy Canara Robeco Asset Management Company Ltd for the Target Rs. 320 By Prabhudas Liladhar Capital Ltd
Better performance could drive earnings upgrade
We initiate coverage on CRAMC with ‘BUY’ rating as we are optimistic about its business prospects given that (1) better equity performance could lead to increase in net equity flow market share (1.3% in H1FY26) and, in turn, improve stock market share, which may translate to AAuM CAGR of 20% over FY26- 28E (~3% higher than industry); (2) higher equity share of 90% could lead to higher core earnings as we are positive on Indian equities over the medium & long term and (3) telescopic pricing would have a limited impact on equity yields as commission payout is high at 70%+. We see healthy core earnings CAGR of 17% over FY25-28E, better than listed peers. Upper band of Rs266 suggests a value of 19.6x on Sep’27 core EPS (UTIAM: 16.7x, ABSLAMC: 22.7x), indicating 42.5% discount to NAM. We assign 24x multiple to arrive at TP of Rs320; CRAMC is attractive in the small-cap space. Initiate with ‘BUY’.
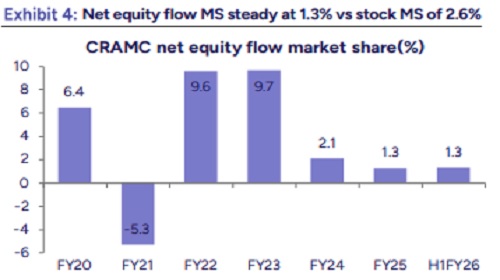
* Strong 1-yr performance may translate to 3-yr bucket: Better performance in the 1-yr and 3-yr buckets led to healthy net equity flow market share of 9.6%/9.7% in FY22/FY23 compared to stock market share of 2.5%/2.9% in Mar’22/Mar’23. Performance slipped thereafter, resulting in net flow market share reducing to 2.1%/1.3% in FY24/25, and stock market share falling to 2.6% in Mar’25. However, since Mar’24, the AMC’s weighted avg performance in the 1-yr bucket has been improving. If this trend continues, the 3-yr bucket would also show improvement, which in turn may lead to higher net inflows. For H1FY26, net flow equity market share stood at 1.3%.
* Being a bank subsidiary supports positive net flows: As subsidiary of Canara Bank (CBK), the AMC benefits from the bank’s widespread branch network and retail customer base, facilitating distribution of MF products across the country. CBK contribution to CRAMC AuM is 8.0%. CBK only sells CRAMC products since 99.7% of overall MF sales by the bank are for CRAMC. Equity distribution is: direct 23% (industry: 25.5%), banca 12.4% and ND/MFD at 29.3%/35.3%. Also, B-30 share for CRAMC is higher at 24% (industry: 18.5%).
* Higher equity share could be an advantage: MAAuM as of Sep’25 was Rs1.2trn, with equity share of 90% (highest among peers), which would expose CRAMC to equity market movement, making earnings more volatile. However, this could be an advantage given that we have a positive outlook on Indian equities over the medium and long term due to low penetration in the Indian AMC space. As superior performance translates to higher equity market share, our core earnings estimates face upside risks since markets have given flat to slight negative returns over last 1 yr.
* Higher commission payout protects net yields: At 33.7bps (FY25), CRAMC’s net MF yields are one of the lowest due to higher commission. It paid out 72.2% of FY25 revenue vs. 54.4% for our AMC basket. As a result, equity yield was lower at 34.4bps (AMC basket: 58bps). Higher payout allowed CRAMC to neutralize the impact of telescopic pricing, despite equity MAAuM seeing a strong 31% CAGR from Mar’22 till date. Hence, during the period, equity yields ranged at 34-36bps. We expect equity yield of ~34bps, anticipating distributor payout to moderate slightly, but remain high.`
Please refer disclaimer at https://www.plindia.com/disclaimer/
SEBI Registration No. INH000000271