Neutral The Ramco Cements Ltd for the Target Rs. 1,030 by Motilal Oswal Financial Services Ltd
Price hikes in the South and debt reduction aid recovery
* The Ramco Cements (TRCL) is expected to benefit from the sharp price hikes in the southern region along with a higher pace of consolidation in the region. The average cement price in the South has increased MoM by INR33/bag (~10%) in Apr’25. TRCL has a higher exposure in the southern region, with 78- 79% of its total volume being sold in the southern markets.
* The Tamil Nadu (TN) government has imposed an INR160/t mining tax on limestone mining. TRCL is estimated to be the most impacted given its higher clinker capacity in TN (~52% of its total capacity). However, the recent price hikes, improvement in the clinker-to-cement (C:C) ratio, and cost reduction measures are likely to more than offset the additional mineral tax burden.
* Further, management is committed to net debt reduction by monetizing noncore assets worth INR10.0b. The company has monetized assets worth INR4.6b by end-FY25. It also prioritized repayment of high-cost borrowings and is following a disciplined capex approach. This strategic decision will lead to a steady reduction in net debt (net debt is likely to decline to INR37.6b by FY27E from INR46.2b as of Dec’24) and improve the leverage ratio (the net debt-to-EBITDA ratio is likely to be 1.8x vs. 3.5x as of Dec’24 TTM).
* Given the recent price hikes in the company’s core markets (South and East) and cost savings initiatives, we raise our EBITDA estimates by ~4%/2% for FY26/FY27. Further, we upgrade our EPS estimates by ~19%/20% for FY26/ FY27, aided by lower interest outgo. Over FY25-26, TRCL’s revenue/EBITDA/PAT CAGR is estimated at ~11%/25%/93%. Key risks to our estimate: 1) reversal of recent price hikes, and 2) lower-than-estimated demand growth.
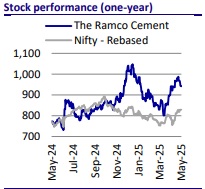
* The stock is currently trading at 14x/12x FY26E/FY27E EV/EBITDA (vs. its longterm average of 15x) and USD119/USD102 EV/t (vs. long-term average of USD130). We value the stock at 13x (earlier 12x) FY27E EV/EBITDA to arrive at our revised TP of INR1,030 (vs. INR900). Reiterate Neutral.
Post-FY25 slump, cement prices in South India rebound strongly
* According to our channel checks, the average cement price in the southern region rose sharply by INR33/bag in Apr’25, marking a robust ~10% MoM rise. This is notably higher than the INR17/bag (~5%) MoM increase in the eastern region and a modest INR3-5/bag MoM (~1%) increase in the northern, central, and western regions. This sharp uptick in the southern region follows a period of underperformance in FY25, during which the average price dipped ~9% YoY.
* TRCL, given its higher exposure in the southern region (sold ~78-79% of its total volume across southern markets), is estimated to benefit the most from increased pricing in the region. Further, increased consolidation in the region and positive commentary by industry players (focusing on balancing out volume growth and profitability at their South India plants) are key positive triggers. This provides a case for upward revision in earnings estimates for the company.
* In the South, we estimate cement capacity additions of 10mtpa/13mtpa in FY26/FY27 by the industry. Of these, ~6.0mtpa (3.0mtpa in FY26/FY27 each) will be added by TRCL. The company is expanding its clinker/grinding capacities at Kurnool, Andhra Pradesh (brownfield expansion), by 3.2mtpa/ 3.8mtpa, to be completed in FY26-27. Apart from that, TRCL is adding a grinding capacity of 2.0mtpa through debottlenecking of existing facilities in the South at a minimal capex. We estimate improving demand/supply equilibrium in the region (incremental demand CAGR at ~8% to surpass the incremental supply of ~6% over FY25-27E) to help sustain the price hikes over the medium-to-longer term.

Limestone tax raises cost pressure, but efficiency steps to offer partial relief
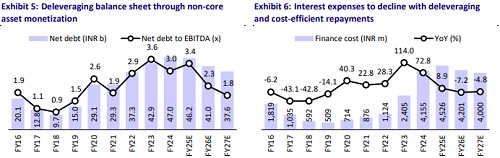
* The TN government has imposed an INR160/t mining tax on limestone mining effective from 4th Apr’25. For TRCL, the tax is estimated to increase its production costs for limestone by INR80/t due to its significant clinker capacity concentration in the state (accounting for ~52% of its total clinker capacity).
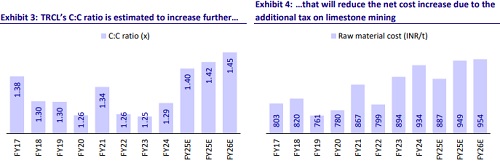
* The company’s C:C ratio declined to 1.27x during FY22-24, compared to its longterm average of above 1.33x during FY12-21. The company’s C:C ratio has improved to 1.4x in 9MFY25, showcasing better operational efficiency. Despite this, there is still room for further reduction in raw material costs by optimizing the use of beneficiation and flotation plants, which helps in enhancing limestone recovery. Moreover, the company can reduce raw material costs by optimizing clinker sourcing strategies for its eastern grinding units.
* Further, TRCL’s initiatives towards increasing its 1) green power share to ~40% (from ~37% in 9MFY25) and 2) alternative fuel share to +7% (vs. ~2% in 9MFY25 and ~6% in FY24) are estimated to help in an overall reduction in opex/t. We estimate the company’s EBITDA/t to improve to INR900/INR970 in FY26/FY27 from INR720 in FY25E (average at INR820/t over FY23-24).
Debt reduction to support lower leverage going forward
* Following investors’ concerns over the continuous rise in net debt, the company has taken effective steps to reduce leverage. It has committed to monetizing non-core assets worth INR10.0b over the 12 months starting Jul’24, as part of its broader strategy to strengthen the balance sheet. The company has monetized assets worth INR4.6b as of end-FY25, and the balance will be monetized in the next few months. We estimate its net debt to decline to INR37.6b by FY27 from INR46.2b as of Dec’24. The net debt-to-EBITDA ratio is likely to decline to 1.8x in FY27 from 3.5x as of Dec’24 (TTM).
* It also prioritized repayment of high-cost borrowing (issuing debentures having a lower coupon rate as compared to term loans from banks) to reduce finance costs. We estimate a 7% YoY reduction in finance costs to INR4.2b in FY26 and a further reduction of ~5% YoY to INR4.0b in FY27.
* Further, it has adopted a disciplined approach to capital expenditure, reducing its capex guidance to INR12.0b p.a. for FY25-26, down from an average of INR18.6b p.a. during FY20-24.
Earnings upgrade due to positive near-term outlook
* Given the recent price hikes in the company’s core markets (South and East) and cost savings initiatives, we raise our EBITDA estimates by ~4%/2% for FY26/FY27. Further, we raise our EPS estimates by ~19%/20% for FY26/FY27, aided by lower interest outgo. Over FY25-26, TRCL’s revenue/EBITDA/PAT CAGR is estimated at ~11%/25%/93%.
* We estimate the company’s cumulative OCF at INR49.1b over FY25-27 vs. INR47.7b over FY22-24. We estimate a cumulative capex of INR27.2b (net of fixed assets sold) over FY25-27 vs. a cumulative capex of INR56.7b over FY22-24. As a result, the company’s cumulative FCF stood at INR21.9b over FY25-27E as compared to a cumulative cash outflow of INR9.0b over FY22-24.
* We believe that recent price hikes and ongoing balance sheet deleveraging are key near-term catalysts that could support the stocks’ performance. However, we remain watchful on the longer-term turnaround story, where sustained profitability, disciplined capital allocation, and meaningful market share gains will be critical structural drivers for a more durable re-rating.
* The stock is currently trading at 14x/12x FY26E/FY27E EV/EBITDA (vs. its longterm average of 15x) and USD119/USD102 EV/t (vs. long-term average of USD130). We value the stock at 13x (earlier 12x) FY27E EV/EBITDA to arrive at our revised TP of INR1,030 (vs. INR900). Reiterate Neutral.
For More Research Reports : Click Here
For More Motilal Oswal Securities Ltd Disclaimer
http://www.motilaloswal.com/MOSLdisclaimer/disclaimer.html
SEBI Registration number is INH000000412