Buy V-Mart Retail Ltd for the Target Rs. 1,085 by Motilal Oswal Financial Services Ltd

Margin improvement continues; valuations attractive
* V-Mart Retail’s (VMART) delivered 22% YoY revenue growth, on the back of 11% blended SSSG, partly boosted by the early festive season.
* Margin continued to improve with ~335bp pre-IND AS EBITDA margin expansion, driven by operating leverage, curtailed ad spends, and lower inventory provisioning, given rising freshness in inventory.
* Given strong growth tailwinds in value fashion, management raised its store additions guidance to ~75 (from ~65 earlier). The company continues to target mid-to-high single-digit SSSG, with consistent improvement in profitability driven by disciplined cost controls.
* We raise our FY26-28E EBITDA by 2-4%, driven by accelerated store expansion and modest margin improvement. We model a CAGR of 18%/ 28% in revenue/EBITDA over FY25-28E, driven by ~14% CAGR in store additions, mid-single-digit SSSG, and further reduction in LR losses.
* VMART has notably underperformed its peers in CY25TD (VMART: -21% vs. +29%/35% for VMM/V2 Retail). VMART trades at ~32x FY27 P/E (vs. 60x for VMM), despite similar growth and better profitability expectations.
* We reiterate our BUY rating on VMART with revised TP of INR1,085, premised on 23x Dec’27 EV/pre-INDAS EBITDA (implies ~12x reported Dec’27 EBITDA). VMART remains one of our top picks in the retail space.
Good 2Q with consistent margin expansion
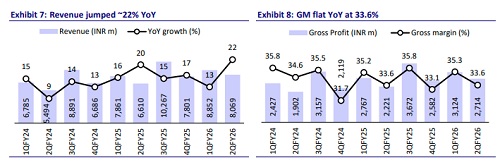
* Revenue grew 22% YoY (already disclosed) to INR8.1b in 2QFY26, driven by 11% blended SSSG and ~14% YoY store additions.
* VMART opened 25 new stores (18 in VMART and seven in Unlimited) and closed two stores (one each in VMART and Unlimited) in 2Q, taking the total store count to 533 (VMART: 438, Unlimited: 95).
* Blended SSSG was boosted by an early festive season. Adjusted for the same, SSSG would have been in mid-single digits.
* Gross profit grew 22% YoY to INR2.7b (in line), as gross margins remained stable YoY at 33.6% (~35bp beat), despite a lower contribution from LR (which has complete revenue flow through to GM).
* Other expenses rose ~6% YoY to INR1.02b (though 2% lower than our estimate), driven by i) ~40bp reduction in A&P spends for VMART and Unlimited formats, ii) ~20bp lower inventory provisioning, and iii) lower losses in the online segment (LR).
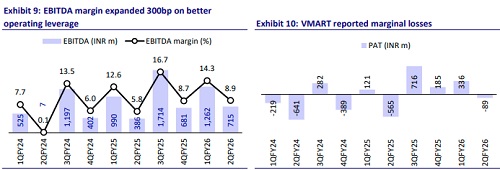
* Resultantly, reported EBITDA stood at INR715m (+85% YoY, 11% beat), and margins expanded 300bp YoY to 8.9% (~90bp beat).
* VMART achieved pre-Ind-AS profitability with EBITDA of INR45b in 2Q (vs. a loss of INR184m YoY).
* Depreciation increased 20% due to a change in lease accounting, while interest costs declined ~55% YoY (11% below our estimate).
* Loss after tax stood at INR89m (vs. our estimate of INR176m loss), aided by higher EBITDA and lower finance costs.
* 1HFY26 revenue/EBITDA grew 17%/44% YoY, with reported PAT of INR247m (vs. ~INR445m loss YoY). Based on our estimates, the run-rate for revenue/EBITDA growth in 2HFY26 is 18%/30%.
Unlimited’s productivity improves; margin expands in VMART
* VMART (core): 2Q revenue grew 23% YoY to INR6.6b, driven by 17 net store additions (up 14% YoY) and ~11% SSSG. Reported monthly SPSF for 1HFY26 grew 4% YoY to INR698. 2Q EBITDA grew 71% YoY to INR605m, as margin expanded ~250bp YoY to 9.1%, driven by operating leverage.
* Unlimited: 2Q revenue grew 22% YoY to INR1.4b, driven by six net store additions (up 14.5% YoY) and ~11% SSSG. Unlimited’s reported monthly SPSF for 1HFY26 grew ~6% YoY to INR592. Unlimited’s 2Q EBITDA grew 36% YoY to INR144m, as margin expanded ~110bp YoY to 10.5%, driven by operating leverage and curtailed A&P spends.
* LimeRoad (LR): Commission income declined ~37% YoY to INR66m, while operating loss reduced ~53% YoY to INR34m (vs. INR46m QoQ, INR73m YoY), driven by a further reduction in advertisement expenses.
Improved profitability and lower inventory lead to healthy FCF generation
* Working capital normalized significantly, with CWC days at 19 days (vs. 26 days in 1HFY25), driven by lower inventory (113 days vs. 115 YoY), and higher payable days (94 vs. 90 YoY). Core WC declined ~13% YoY to INR1.76b.
* Driven by a sharp increase (2.6x YoY) in pre-INDAS EBITDA and favorable working capital movement, OCF (after leases and interest) improved to INR865m (vs. outflows of INR11m YoY). With capex largely stable YoY, FCF
Key highlights from the management commentary
* Demand: Consumer sentiment improved in 2Q, driven by GoI’s policy support, lower inflation, and early festive momentum. However, the delayed withdrawal of the monsoon in the East and coastal regions impacted the festive demand. GST rollout had a limited impact on low-ticket items but aided overall market sentiment. Diwali performance was positive but fell short of management’s expectations, though demand picked up with the onset of winter.
* Regional performance: SPSF growth in Tier-1 markets was subdued at ~1%, reflecting spillover effects from disruptions in Eastern markets (lack of Bangladesh footfalls) during the festive period and continued underperformance in Southern clusters, AP, and Telangana, where consumer traction remained weak. In contrast, Tier-4 markets outperformed. Regionally, Tamil Nadu continues to deliver strong growth, which has encouraged management to increase its penetration in the market through Unlimited.
* Outlook: Management expects footfalls and discretionary spending to improve with easing inflation, rising consumer confidence, and is targeting mid- to highsingle-digit SSSG. However, the festive season shift to 2Q may temper 3Q growth optically.
* Store expansion continues aggressively with 56 stores added YTD (40 in 1H, 16 in 3Q so far). Management has raised its guidance of store additions to 75 (from 65 earlier. New stores opened over the past 12–18 months are outperforming on growth and EBITDA, reflecting better site selection and operational maturity.
* Margins: VMART’s pre-IND-AS margin improved ~210bp YoY in 1H, driven by operating leverage, reduced inventory provisioning, and curtailed ad spends. However, management has conservatively guided for only a slight improvement in margin for FY26 (vs. 4.4% in FY25), based on mid-single digit SSG.
Valuation and view
* The improved productivity of VMART/Unlimited stores, the closure of nonperforming stores, and lower losses in the online segment have led to an improvement in VMART’s overall profitability.
* VMART remains a key beneficiary of the unorganized-to-organized retail shift and the massive growth opportunity in value fashion.
* We raise our FY26-28E EBITDA by 2-4%, driven by accelerated store expansion and modest margin improvement. We model a CAGR of 18%/28% in revenue/EBITDA over FY25-28E, driven by ~14% CAGR in store additions, midsingle-digit SSSG, and further reduction in LR losses.
* VMART has significantly underperformed peers in CY25TD (VMART: -21% vs. +29%/35% for VMM/V2 Retail). VMART trades at ~32x FY27 P/E (vs. 60x for VMM), despite similar growth and better profitability expectations.
* We reiterate our BUY rating on VMART with a revised TP of INR1,085, premised on 23x Dec’27 EV/pre-INDAS EBITDA (implies ~12x reported Dec’27 EBITDA). VMART remains one of our top ideas in the retail space.
For More Research Reports : Click Here
For More Motilal Oswal Securities Ltd Disclaimer
http://www.motilaloswal.com/MOSLdisclaimer/disclaimer.html
SEBI Registration number is INH000000412