Buy Trent Ltd for the Target Rs. 5,200 by Motilal Oswal Financial Services Ltd

Strong cost control continues; revenue growth recovery vital for re-rating
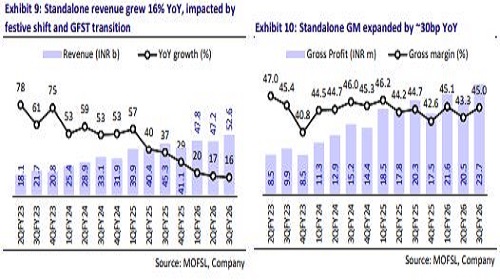
* Trent’s revenue growth deceleration continued with 16% YoY growth in 3Q (vs. 39% YoY area addition), due to marginally negative LFL, reflecting the impact of the festive shift, subdued consumer sentiment, and lower initial productivity of newly added stores.
* However, strong cost discipline, especially RFID-led manpower optimization and variable cost structure, drove ~90bp expansion in pre-Ind AS EBITDA margin to 15.6%, driving ~23% YoY pre-IND AS EBITDA growth.
* Management indicated that consumer sentiment remained muted in 3QFY26, though the trends are gradually improving and the medium-term outlook remains positive.
* However, the bulk of manpower cost efficiencies have now been realized and investments in technology, logistics and warehousing would be key for driving optimal productivity and profitability.
* Star business continued to struggle with modest revenue growth of ~1% YoY as several stores were closed for upgrades. Management acknowledged the pace of store additions has been weaker than initial expectations and it is looking to accelerate the same.
* We marginally cut our FY27-28E pre-IND AS EBITDA by ~2% each. We build in a CAGR of 17%/18%/15% in standalone revenue/pre-IND AS EBITDA/adj. PAT over FY25-28E, driven mainly by retail footprint additions.
* Reiterate BUY on Trent with an unchanged TP of INR5,200, premised on 50x FY28E EV/pre-IND AS EBITDA for the standalone (Westside and Zudio) business, 2.5x EV/sales for Star JV, and ~1.5x EV/EBITDA for Zara JV.
* After correction (-30% in last 12 months), the stock currently trades at ~57x FY28E standalone P/E, excluding the contribution from Star and Zara JV.
Strong margin performance continues; 3Q pre-INDAS EBITDA up 23% YoY
* Standalone revenue at INR52.6b grew 16% YoY (disclosed earlier), driven by ~39% YoY net area additions as revenue per sqft declined ~18% YoY.
* Trent’s LFL growth for fashion portfolio was marginally negative in 3QFY26, due to a festive shift. For 9MFY26, it was in low single digits.
* Gross profit grew 17% YoY to INR23.7b (in line) as gross margin expanded ~30bp YoY to 45% (~50bp ahead).
* Despite ~39% YoY net store additions, employee costs grew by a modest ~3% YoY, while SG&A and other costs rose ~11% YoY.
* Trent’s occupancy cost (rentals above EBITDA) grew ~4% YoY, while lease rentals (below EBITDA) rose ~48% YoY, resulting in overall rental growth of ~18% YoY.
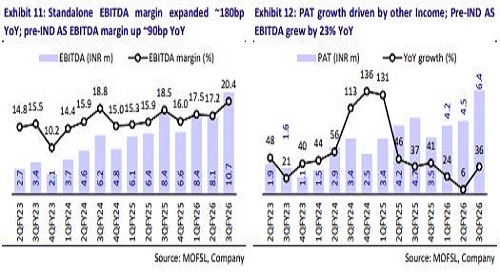
* Standalone pre-INDAS EBITDA grew 23% YoY in 3QFY26 to INR8.22b (also 23% YoY in 9M), with pre-INDAS EBITDA margin of 15.6% (up ~90bp YoY).
* Reported EBITDA grew 28% YoY to INR10.7b (3% above our est.), with reported EBITDA margins expanding ~195bp YoY to 20.4% (~65bp ahead).
* Standalone pre-Ind AS EBIT margin stood at 13.8% (up ~60bp YoY).
* Depreciation (+48% YoY) and interest costs (+17% YoY) jumped, while other income surged 2.7x YoY to INR1.53b, likely on proceeds from Zara India share buyback.
* Trent provided ~INR258m toward labor code provisions. Adjusted for the same, PAT grew 42% YoY to INR6.7b (~20% beat), driven by higher EBITDA, other income and lower tax rate.
Relatively muted consolidated performance
* Consolidated revenue grew 15% YoY to INR53.5b.
* Reported EBITDA grew 28% YoY to INR10.8b with ~310bp YoY margin improvement to 20.2%.
* Operating (pre-IND AS) EBITDA grew ~20% YoY to INR8.4b, with margin expanding ~70bp YoY to 15.7%.
* Adjusted PAT stood at INR5.3b (up ~7% YoY), as higher EBITDA was partly offset by higher D&A (up 50% YoY) and finance costs (+18% YoY).
The pace of store additions continued, especially in Westside
* The pace of store additions remained robust with 63 net store additions, bringing the total fashion format store count to 1,164 (up 28% YoY).
* Westside recorded yet another highest quarterly net store addition at 17 (13 in 2Q), taking the total store count to 278 (+17% YoY).
* Zudio witnessed 48 net store openings in 3QFY26 (89 in 9MFY26 vs. 90 in 9MFY25), to reach 854 stores (+34% YoY).
* Trent’s other fashion format store count declined by 2 QoQ to 32 (-6% YoY).
* We note that store additions typically pick up pace in 4Q and all eyes would be on further scale-up of Trent’s fashion footprint as it remains the biggest growth driver amid weakening SSSG.
Star business: Muted performance with dip in revenue
* Revenue (ex-GST) inched up 1% YoY as several stores underwent upgrades in 3Q and 9MFY26.
* Star added 2 net stores in 3QFY26 to reach 79 stores (3 openings, 1 closure).
* Calc. annualized revenue per sqft declined ~9% YoY to INR26.9k (vs. flat YoY for DMart at INR38.9k) and annualized revenue per store declined ~4% YoY to INR459m (vs. -1% YoY for DMart at INR1.6b).
* The share of own brands now stands at ~74% of Star’s revenue (stable YoY).
* Management acknowledged that the pace of store additions has been slower (vs. expectations) and is looking to accelerate in coming periods.
Highlights from the management commentary
* Demand: 3Q was impacted by a partial shift in festive (to 2Q) and relatively muted consumer sentiment. However, the company is witnessing a gradual improvement and expects GST rationalization benefits to flow through for lifestyle categories over the medium term.
* LFL growth in 3Q was marginally negative due to calendar effects. Trent is facing certain supply-chain related challenges due to geopolitical disturbances. However, LFL was in low single digits for 9MFY26.
* Growth strategy: The company’s intent is to expand its reach and grow its revenue share through increased density across key markets. The approach is delivering encouraging initial outcomes, though new markets are likely to become more relevant over a two-to-three-year period.
* Competitive intensity remains elevated, but Trent’s own-brand, direct-toconsumer model provides tighter control over pricing, inventory and product differentiation, supporting gradual premiumization and a defensible competitive position.
Valuation and view
* Trent's growth rate has decelerated materially over the last few quarters due to weak LFL amid a subdued demand environment and self-cannibalization of existing stores to gather higher revenue in select micro-markets.
* However, the company continues to display strong cost controls (especially tech-led reduction in employee costs) to report healthy EBITDA growth.
* We continue to like Trent for its robust footprint additions, retail formats with robust store economics, long runway for growth in Star (presence in just 11 cities), and potential scale-up of emerging categories (Beauty, Innerwear and Footwear). However, revenue growth acceleration remains a key trigger.
* Our FY26E pre-IND AS EBITDA is unchanged, while we cut FY27-28E pre-IND AS EBITDA by ~2% each, driven primarily by higher lease rental costs.
* We build in a CAGR of 17%/18%/15% in standalone revenue/pre-IND AS EBITDA/adj. PAT over FY25-28E, driven mainly by retail footprint additions (~20% CAGR). Our pre-IND AS EBITDA margin is stable at ~13% over FY26-28E.
* Reiterate BUY on Trent with an unchanged TP of INR5,200, premised on 50x FY28E EV/pre-IND AS EBITDA for the standalone (Westside and Zudio) business, 2.5x EV/sales for Star JV, and ~1.5x EV/EBITDA for Zara JV.
* After correction (-30% in last 12 months), the stock currently trades at ~57x FY28E standalone P/E, excluding the contribution from Star and Zara JV.
For More Research Reports : Click Here
For More Motilal Oswal Securities Ltd Disclaimer
http://www.motilaloswal.com/MOSLdisclaimer/disclaimer.html
SEBI Registration number is INH000000412


.jpg)