


Buy Motherson Wiring Ltd for the Target Rs. 68 by Motilal Oswal Financial Services Ltd
Outperformance to core drives earnings beat
Well-placed to outperform industry growth
* Motherson Wiring’s (MSUMI) Q4 earnings were ahead of estimates, primarily driven by better-than-expected revenue growth. Its three new greenfields are well on track and expected to help MSUMI outperform industry growth in the next couple of years.
* Given the better-than-expected performance in Q4 and steady ramp-up at its greenfields, we have raised our estimates by 3%/5% for FY26E/FY27E. We believe MSUMI deserves rich valuations, given its strong competitive positioning, top-decile capital efficiency, and benefits of EVs and other mega-trends in autos. Reiterate BUY with a TP of INR68 (premised on 34x FY27E EPS).
Earnings beat largely driven by better-than-expected revenue growth
* MSUMI’s Q4 earnings were ahead of estimates, primarily driven by betterthan-expected revenue growth.
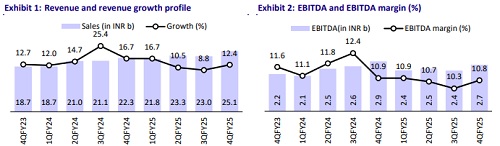
* Revenue grew 12% YoY to INR25.1b vs our estimate of INR23.5b. This compares to the PV industry’s growth of just 5% YoY. The revenue growth was likely supported by copper inflation, which rose 15% YoY.
* EBITDA margins contracted 220bp YoY to 10.8% (+50bp QoQ and ahead of our estimate of 10.5%), largely due to the impact of start-up costs of its three new greenfields. Adjusted for the same, its margins would have been 12.4%.
* Overall, PAT declined 14% YoY to INR1.65b (ahead of our estimate of INR1.5b). Adjusted for the impact of start-up costs, PAT would have been flat YoY at INR1.9b.
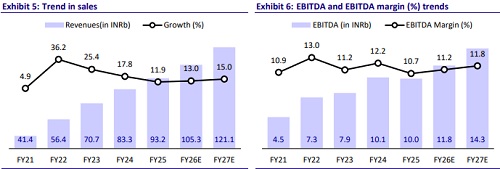
* For FY25, MSUMI posted 12% revenue growth to INR93b. This compares to the PV industry growth of 3% posted this year.
* Revenue mix for FY25: PVs: 61%, CV: 10%, 2Ws: 13%, off road: 7%, and others: 9%.
* EBITDA margin contracted 150bp YoY to 10.7% due to the impact of start-up costs. Adjusted for this, margins would have been flat YoY at 12.3%.
* Overall, reported PAT declined 5% YoY to INR6.1b. Adjusted PAT stood at INR7.1b, up 11% YoY.
* RoCE for FY25 remained healthy at 41.4%. ? MSUMI delivered FCF of INR1.9b in FY25.
Highlights from the management commentary
* MSUMI is progressing through various stages of completion for three new greenfields: 1) Pune plant – SOP for EV + ICE plant commenced in Q2FY25, while the EV-only plant began operations in 4QFY25; 2) Navagam (Gujarat) plant – SOP for the EV-only plant is expected by 1QFY26, followed by the EV + ICE plant by Q2FY26; 3) SOP for the Karkhoda plant is scheduled for Q2FY26.
* These are sizeable plants with a peak combined revenue potential of INR21b, i.e. ~25% of MSUMI’s FY24 revenues. The company has secured business from large Indian OEMs, including MSIL, M&M, and TTMT, for its upcoming new model launches in the coming years. Management has also indicated that MSUMI remains the preferred supplier for new-age vehicles by MSIL, MM, and TTMT.
* The EV mix of total revenues stood at 4% for Q4FY25.
* Capex guidance for FY26 stands at INR2b. The company has invested about INR400-600m in each plant, excluding the cost of land and buildings that are leased from SAMIL.
* MSUMI is a supplier for nine out of the top 10 selling PV models in FY25.
Valuation and view
* We expect EBITDA margin to expand in FY26, led by a better product mix, rampup of new greenfield plants, and localization efforts.
* We believe MSUMI deserves rich valuations, given its strong competitive positioning, top-decile capital efficiency, and benefits of EVs and other megatrends in Autos. The stock trades at 34.8x/28.5x FY26E/FY27E EPS. Reiterate our BUY rating with a TP of INR68 (premised on 34x FY27E EPS).
For More Research Reports : Click Here
For More Motilal Oswal Securities Ltd Disclaimer
http://www.motilaloswal.com/MOSLdisclaimer/disclaimer.html
SEBI Registration number is INH000000412


 Ltd.jpg)