Buy Grasim Ltd for the Target Rs 3,440 by Motilal Oswal Financial Services Ltd
Execution-led growth in paints; VSF margin expanded Paint scale-up continues; multi-engine growth story intact
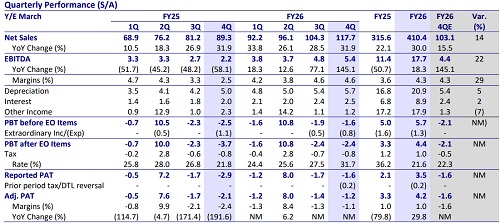
* GRASIM’s 4QFY26 operating performance was above our estimates, led by a beat across key segments. EBITDA jumped 2.5x YoY to INR5.4b (~22% beat). OPM surged 2.1pp YoY (flat QoQ) to 4.6% (est. 4.3%). Adj. loss was INR1.2b (est. 1.6b) vs. a loss of INR2.1b in 4QFY25.
* Management indicated that Birla Opus revenue market share expanded by 3.7pp to cross 10% in Mar’26. Growth is being driven by rapid distribution scale-up (50,000+ dealers, 11,500 towns) and improving dealer throughput. It sees significant headroom for expansion through deepening product penetration across its portfolio. Dealers with over 18 months of association are already achieving 25-50% share in their outlets, with throughput levels comparable to incumbents. It estimates the paint industry to transition from single-digit growth in FY26 to double-digit growth in FY27.
* We raise our FY27 EPS estimate by 2.6x on account of high dividend income from UTCEM (pre-tax cash inflow of ~INR40b), while we maintain our FY28 EPS estimate. We reiterate our BUY rating with a TP of INR3,440 (based SoTP).
VSF margin expands 5.5pp YoY; chemical margin dips 50bp YoY
* GRASIM’s standalone revenue/EBITDA stood at INR117.7b/INR5.4b (up 32%/ 2.5x YoY and up 14%/22% vs. our estimates) in 4QFY26. Loss stood at INR1.2b vs. loss of INR2.1b in 4QFY25.
* VSF segment: Sales volume/realization grew ~11%/2% YoY. EBITDA surged 2x YoY (+20% QoQ) to INR5.9b. OPM expanded 5.5pp YoY (1.3pp QoQ) to ~13%. EBITDA/kg was INR24 vs. INR13/INR21 in 4QFY25/3QFY26. Chemical segment: volume grew ~11% YoY, while realization declined ~4% YoY. EBITDA rose ~3% YoY to INR3.0b. Its OPM contracted 50bp YoY to ~12%. Paint revenue grew ~52% YoY to INR14.0b, and B2B revenue surged 2.3x YoY to INR28.5b. Losses in these high-growth businesses stood at INR3.0b vs. losses of INR3.1b in 4QFY25/3QFY26 (each).
* In FY26, revenue/EBITDA/adj. PAT stood at INR410.4b/INR17.7b/INR4.2b (+30%/+55%/+30% YoY). OPM increased 70bp YoY to 4.3%. VSF/chemcial margin increased 70bp YoY (each) to ~10%/15%. OCF stood at INR26.8b vs. cash outflow at INR254m in FY25. Capex stood at INR20.9b vs. INR38.3b in FY25. Net cash inflow stood at INR5.9b vs. net cash outflow at INR38.6b
Valuation and view
* GRASIM reported strong results, supported by strong execution in paints and B2B e-commerce, margin expansion in VSF and strong volume growth in chemicals. Brand investments, contractor ecosystem expansion, and premium product mix (~65% of revenue) continue to strengthen its position in the paint business. While cost pressure remains a near-term headwind, it expects margin improvement through operating leverage, procurement efficiencies, and scale benefits. It targets to build an INR100b profitable franchise by FY28. Further, there has been improvement in VSF prices, which should continue to drive healthy margin in the coming quarters.
* We reiterate our BUY rating with a TP of INR3,440 as we value its:
1) holding in listed subsidiaries by assigning a discount of 35% on our TP for coverage companies
2) standalone business at 6x FY28E EV/EBITDA
3) paint business at 2x of investments
4) B2B e-commerce at 1.5x of FY28E revenue
5) renewable business at 10x EV/EBITDA.
For More Research Reports : Click Here
For More Motilal Oswal Securities Ltd Disclaimer
http://www.motilaloswal.com/MOSLdisclaimer/disclaimer.html
SEBI Registration number is INH000000412