Buy Mahindra & Mahindra Ltd for the Target Rs.3,687 by Motilal Oswal Financial Services Ltd
FES performance continues to impress
Well-positioned to outperform in both the Auto and FES segments
* Mahindra & Mahindra (MM)’s 1QFY26 PAT at INR34.4b was ahead of our estimate of INR30.7b due to higher other income even as EBITDA margin came in line. While the FES segment’s margin improved 140bp YoY to 19.8%, the auto segment’s margin remained steady at 8.9%, affected by the contract manufacturing margin for its e-SUVs.
* While MM has outperformed its own targets of earnings growth and RoE of 18%, management remains committed to delivering 15-20% EPS growth and 18% RoE. This ensures sustained profitability and shareholder value. Reiterate BUY with a TP of INR3,687 (based on Jun’27E SoTP).
Margins in line
* MM’s revenue grew 26% YoY to INR341b, in line with our estimate.
* EBITDA margin also came in line with our estimate at 14.3% in 1QFY26. ? However, MM reported higher-than-expected other income at INR6.4b (est. of INR3.7b). This led to a strong 32% YoY growth in PAT to INR34.4b.
* On a segmental basis, the auto segment’s margin was in line with our estimate at 8.9%. However, this included margin dilution on account of contract manufacturing of EVs for MEAL. While the core auto ICE margin came in at 10%, e-SUV contract manufacturing delivered a 0.2% PBIT margin.
* At the MEAL level, MM has delivered a 2.9% EBITDA margin but a -3.5% EBIT margin. MM could deliver a positive EBITDA margin on EVs as it is: 1) currently selling only the top-end variants, and 2) leveraging its existing capacity, which helps absorb cost overheads.
* MM’s tractor margin remained healthy and was up 140bp YoY to 19.8% (ahead of our estimate of 18.8%). Core tractor PBIT margin (ex-farm machinery and power) improved 100bp to 20.7% for the quarter.
* While the Auto segment PAT grew 32% YoY to INR17.6b, the FES segment PAT rose 7% YoY to INR13.2b during the quarter.
* RoE for 1Q stood at 20.6%, well ahead of its target of 18%.
Highlights from the management commentary
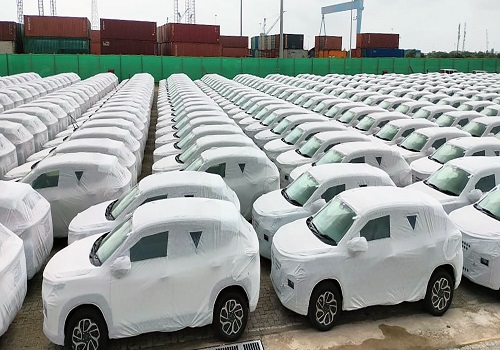
* In the auto segment, MM’s revenue market share improved 570bp to 27.3% in 1Q. Further, its LCV share (<3.5T segment) improved 340bp YoY to 54.2%.
* MM’s tractor share also improved by 50bp to 45.2% for the quarter.
* The company continued to maintain its growth guidance of mid-to-high teens for UVs in FY26E, aided by healthy traction seen for most of its models.
* It expects rising steel prices to drive cost inflation in the coming quarters.
* MM has an adequate rare earth inventory, at least for the next two quarters, and hence it does not expect any production disruption. It has explored substitutes such as light earths and ferrites as the alternates for rare earth materials.
Valuation and view
* We believe MM is well-positioned to outperform across its core businesses, fueled by a healthy recovery in rural areas and new product launches in both UVs and tractors. We estimate MM to post a CAGR of ~15%/14%/18% in revenue/ EBITDA/PAT over FY25-27.
* While MM has outperformed its own targets of earnings growth and RoE of 18% in FY24, management remains committed to delivering 15-20% EPS growth and 18% RoE. This ensures sustained profitability and shareholder value. Reiterate BUY with a TP of INR3,687 (based on Jun’27E SoTP).


For More Research Reports : Click Here
For More Motilal Oswal Securities Ltd Disclaimer
http://www.motilaloswal.com/MOSLdisclaimer/disclaimer.html
SEBI Registration number is INH000000412

