Buy Dalmia Bharat Ltd for the Target Rs.2,230 by Motilal Oswal Financial Services Ltd

Strong growth setup; valuations compelling Underappreciated cost advantage, re-rating at the cusp of cycle turn
* The recent sharp correction in DALBHARA stock was triggered by the news that the MCA has directed investigation authorities to reinvestigate the 2019 mutual fund unit fraud case. However, the company has categorically denied allegations and stated that it has not received any such communications. Barring this news-related overhang and the near-term profitability pressure across the industry, we believe DALBHARA’s underlying business fundamentals and operational performance remain steady.
* DALBHARA continues to strengthen its cost leadership position, with FY26 opex/t remaining the lowest among the top-four cement players and ~13% below that of our coverage universe. The company has benefited from its East-centric footprint, proximity to domestic coal sources, higher renewable energy usage, flexible fuel mix, and ongoing logistics optimization initiatives.
* Renewable energy contribution increased to 47% in 4QFY26 from ~39% a year ago, while freight costs remained lower despite sharp fuel inflation, aided by reduced lead distance and higher direct dispatches. Additionally, improved clinker factor and blending ratios have helped lower raw material costs. It is targeting cumulative savings of INR50-100/t over the next 15-18 months through continued efficiency measures.
* Over the past two years, the company’s capacity additions have lagged its historical trend (~5% CAGR over FY24-26 vs. ~11% CAGR over FY22-24), which also constrained volume growth. However, the company accelerated its expansion plans, initially within its core market – South, where it has strong brand and distribution network, which enables a faster ramp-up of capacity utilization and drives better volume growth.
* As the cycle turns, DALBHARA appears well positioned for a swift re-rating backed by strong presence in the east and south regions, low-cost producers and potential for capacity utilization improvement. We value the stock at 12x FY28E EV/EBITDA to arrive at our TP of INR2,230. Reiterate BUY.
Structural cost leadership continues through operational efficiency
* DALBHARA has been delivering meaningful progress across multiple operating cost parameters. The company’s opex/t is the lowest among the top-four players and ~13% lower vs. our coverage universe in FY26. This superior cost position is driven by its East-centric operational footprint with proximity to domestic coal sources, flexible fuel mix, higher renewable energy usage, and continued logistics optimization initiatives.
* On the power and fuel costs, the company expanded its renewable power capacity to 449MW, resulting in renewable energy contribution increasing to 47% in 4QFY26 vs. ~39% in 4QFY25. Further, flexibility to switch between petcoke and domestic coal supported by its plant presence near eastern coal belts provides cushion against high imported fuel prices
* On the logistics, the company’s freight cost/t fell ~3% in FY26 compared to FY20, despite ~26-27% surge in petrol/diesel prices over the same period. The improvement was driven by increasing direct dispatch and reducing lead distance (~280kms vs. 300Kms+ in FY20). Further optimization initiatives such as route rationalization, enhanced rail utilization, and commissioning of a new bulk terminal in Chennai are underway to reduce freight cost/t.
* Further, the company’s raw material cost/t declined ~2% YoY in FY26, despite levy of additional mineral-bearing land tax by the Tamil Nadu government. Improving clinker factor and blending ratios has helped the company to reduce raw material cost. It is targeting a cumulative savings of INR50-100/t, driven by these cost measures over the next 15-18 months.
Valuation and view
* We estimate a CAGR of 9%/11% in revenue/EBITDA over FY26-28, and PAT CAGR of only ~3%, mainly due to an increase in depreciation and interest cost amid aggressive capex plans. We estimate a volume CAGR of ~8% over FY26-28 (vs. ~2% over FY24-26). EBITDA/t is estimated to decline to INR993/t (due to cost pressure) vs. INR1,015 in FY26, but may improve to INR1,081 in FY28, led by cost-saving measures and an expected decline in fuel prices.
* We estimate the company’s cumulative OCF to increase to INR57.1b over FY27- 28 vs. INR43.9b over FY25-26. However, we estimate cumulative net cashoutflow of INR4.9b over FY27-28 vs. net cash outflow of INR2.7b over FY25-26, due to aggressive capex. The company’s net debt is estimated to rise to INR32.6b by FY28 from INR14.2b in FY26. Its net debt-to-EBITDA ratio is estimated at 1.2x vs. 0.9x in FY26E.
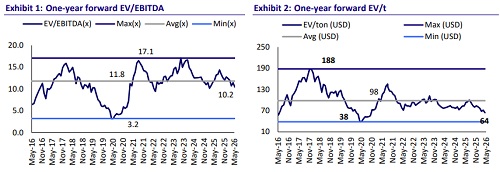
* The stock is currently trading at 10x/9x FY27E/FY28E EV/EBITDA vs. its historical one-year forward average EV/EBITDA multiple of 12x. We believe key catalysts for the stock performance will be a combination of –
1) softening of fuel prices
2) a strong price action in its core markets (east and south)
3) timely execution of ongoing capacity expansion projects
4) a gradual improvement in capacity utilizations. We value the stock at 12x FY28E EV/EBITDA to arrive at our TP of INR2,230. Reiterate BUY.
For More Research Reports : Click Here
For More Motilal Oswal Securities Ltd Disclaimer
http://www.motilaloswal.com/MOSLdisclaimer/disclaimer.html
SEBI Registration number is INH000000412


.jpg)