Buy Birla Corporation Ltd for the Target Rs. 1,540 by Motilal Oswal Financial Services Ltd
Performance above estimates; announces growth plans
Aiming for ~6-8% growth in FY26E, in line with industry
* BCORP’s 4QFY25 earnings were above our estimates, driven by higher-thanestimated volume and realization. EBITDA grew ~13% YoY to INR5.3b (~50% beat). EBITDA/t grew ~5% YoY to INR1,027 (est. INR721), and OPM surged 1.2pp YoY to~19% (est. ~14%). Adj. PAT rose ~52% YoY to INR2.9b (~175% above estimate, aided by higher other income, lower interest cost, and ETR).
* Management highlighted that the QoQ spike in realizations was led by price hikes in the North & East regions, a better regional mix, and higher premium product sales. Current realization is flat vs. the 4QFY25 average. It targets volume growth of ~6-8% in FY26, in line with the industry. Further, BCORP announced the next leg of capacity expansion to increase its clinker/ grinding capacity to 16.7mtpa/27.6mtpa from 13.0mtpa/20.0mtpa currently.
* We raise our EBITDA by 14%/8% for FY26E/FY27E, factoring in the outperformance in realization in 4Q. The stock trades inexpensively at 7x/6x FY26E/FY27E EV/EBITDA and EV/t of USD60/USD57. We value the stock at 8x FY27E EV/EBITDA to arrive at our revised TP of INR1,540 (vs. INR1,320). Reiterate BUY.
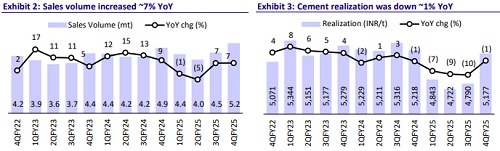
Volume up 7% YoY (5% beat); realization/t down 1% YoY (6% beat)
* Consol. revenue/EBITDA/Adj. PAT stood at INR28.1b/INR5.3b/INR2.9b (up 6%/13%/52% YoY and +11%/+50%/+175% vs. our estimates) in 4QFY25. Sales volumes increased 7% YoY to 5.2mt (+5% vs. our estimate). Cement realization declined 1% YoY (up 8% QoQ) at INR5,177 (+6% vs. estimate).
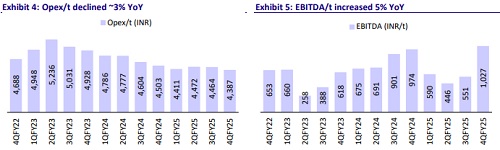
* Opex/t declined ~3% YoY (in line with estimate), led by a 6% dip in variable costs. Employee cost/other expense per ton declined ~7%/2% YoY, whereas freight cost/t increased ~4% YoY. OPM increased 1.2pp YoY to ~19%, and EBITDA/t increased 5% YoY to INR1,027. Depreciation/Interest costs dipped 5%/11% YoY, whereas ‘Other income’ increased 88% YoY. ETR stood at ~22% vs. 29% in 4QFY24.
* In FY25, consol. revenue/EBITDA/adj PAT declined ~5%/15%/22% YoY. Volume grew 2% YoY, while realization fell ~7% YoY. EBITDA/t declined 17% YoY to INR674. OPM contracted 1.7pp to ~13%. OCF stood at INR16.7b vs. INR16.2b in FY24. Capex stood at INR4.5b vs. INR5.3b in FY24. FCF stood at INR12.3b vs. INR10.9b in FY24.
Highlights from the management commentary
* Mukutban operations have exceeded their internal expectations. BCORP is seeing a steady ramp-up and is currently operating at 80% capacity utilization. It targets this to further utilization to 85% in FY26.
* Fuel consumption costs were INR1.39/Kcal vs. INR1.50/Kcal in 3QFY25. The green power share was ~25%. It is working to reduce power costs by raising green power share (via solar, hybrid, and WHRS) to ~36–37% going forward.
* Accrued incentives stood at INR410m for 4QFY25 and INR1.03b in FY25.
Valuation and view
* BCORP reported sharp sequential improvement in profitability, led by an increase in realization and controlled opex/t. Steady growth at the Mukutban plant also helped it to achieve strong performance. The company announced capacity expansion plans to be commissioned over FY28-29. Till then, due to capacity constraints and a peak capacity utilization, we factor in a moderate volume CAGR of ~5% over FY25-27. We estimate BCORP’s EBITDA/t to improve to INR785/INR832 in FY26/FY27 vs. INR672 in FY25 (five-year average INR820).
* BCORP trades inexpensively at 7x/6x FY26E/FY27E EV/EBITDA and EV/t of USD60/USD57. We value the stock at 8x FY27E EV/EBITDA to arrive at our revised TP of INR1,540 (earlier INR1,320). Reiterate BUY.
For More Research Reports : Click Here
For More Motilal Oswal Securities Ltd Disclaimer
http://www.motilaloswal.com/MOSLdisclaimer/disclaimer.html
SEBI Registration number is INH000000412