Accumulate Mahindra & Mahindra Ltd for the Target Rs. 3,950 By Prabhudas Liladhar Capital Ltd
Profit beats estimates due to higher other income
Quick Pointers:
* Tractor outlook improved to low double digits from mid-single digits
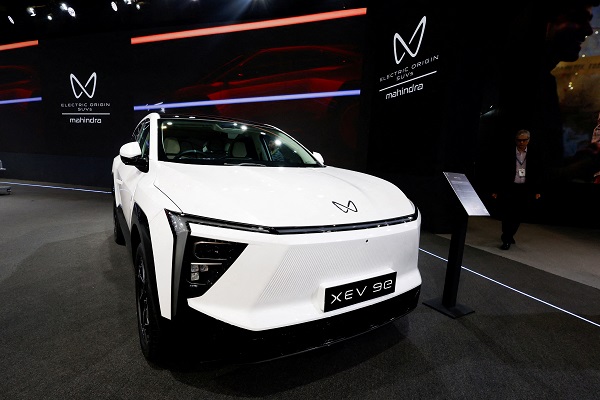
* M&M enjoys leadership position in terms of revenue in the e-SUV market
M&M’s Q2FY26 standalone revenue grew by 21.3% YoY, missing BBGe marginally by 1.4% (was 1.3% above PLe) due to lower-than-expected blended realization. Lower other expenses and higher non-operating income helped adj PAT (adjusted for loss in JV & subsidiaries) to grow by 17.7% YoY, beating BBGe/PLe by 14.9%/15.2%. The group continues to show strong performance across the business with steady expansion in margins and market share. We marginally tweak volume and realization estimates and expect overall volume and blended realization to grow at 9.1% and 5.0% CAGR, respectively, over FY25-28E, translating to revenue/EBITDA/EPS CAGR of 15.2%/13.5%/12.7%. Retain “ACCUMULATE” rating with TP of Rs3,950 (previous Rs3,845), valuing the core business at 26x P/E on its Sep’27 earnings and its share of subsidiaries’ value based on respective market prices. The stock currently trades at P/E of 26.4x/23.9x based on FY27E/FY28E consensus earnings.
In Q2FY26, standalone business’ blended realization grew by 2.5% YoY, while gross margin contracted by 144bps YoY to 24.4% (in line with street estimates). EBITDA grew by 23.1% YoY, while margin expanded 20bps YoY to 14.5% (beating BBGe/PLe by 30bps/45bps), owing to lower other expenses YoY and lower staff costs in proportion to revenue. Reported PAT increased by 17.7% YoY, beating estimates due to lower depreciation and higher non-operating income.
Leader in SUV market share: It achieved SUV volume of 146k units (+7% YoY) aiding it to reach #1 position in revenue market share at 25.7% (+390bps YoY). eSUV penetration at 8.7% (vs. industry at 7.4%) was +90bps QoQ, although with 33.1% revenue market share (130bps lower than the leading OEM), it achieved 2nd position. Auto standalone EBIT margin was 10.3% (9.2% with contract manufacturing). Farm segment (incl. Gromax) sold 123k units (+32% YoY) and saw highest ever Q2 market share by volume at 43.0% (+50bps YoY), retaining #1 position. LCV (<3.5T) volume of 70k units (+13% YoY) took its market share to 53.2% (+100bps YoY). It also achieved #1 position in e-3W (volume market share at 42.3%).
At consolidated level, revenue grew by 22% YoY. PAT grew by 28% YoY led by Farm PAT (+54% YoY), Auto PAT (+14% YoY; impacted by GST 2.0 transition and logistics issue), MMFSL (delivering as guided) PAT (+45% YoY), TechM (which is on track) PAT (+35% YoY), and Growth Gems (which are accelerating) PAT (+22% YoY). It achieved 35% EPS CAGR over H1FY22 to H1FY26 vs. the guidance of 15- 20%. Annualized ROE was up at 19.4%, but going ahead, it should be ~18% (as previously guided), given there would be further investments to make to drive growth.


Please refer disclaimer at https://www.plindia.com/disclaimer/
SEBI Registration No. INH000000271












.jpg)
 Ltd.jpg)