Buy UltraTech Cement Ltd For Target Rs.13,800 by Motilal Oswal Financial Services Ltd
Strategic growth fuels market leadership
Building, leveraging, and building again UltraTech Cement (UTCEM) is anticipated to benefit from its increasing scale of operations, cost-saving strategies, low capex cost/t, and strong cash flow generation. In this note, we highlight the company’s strategy of ‘build, leverage, and build again’. UTCEM has successfully built capacity (capacity CAGR stood at ~10% over FY15-24 vs. the industry CAGR of ~5%), leveraged this capacity through higher utilization (average of ~76% over FY15-24 vs. industry average at ~67%), and generated strong cash flows. Currently, UTCEM is in the process of rebuilding its capacity and balancing its market presence to maintain its position as the industry’s largest player, while also capitalizing on India’s next growth cycle.
Leading and unstoppable
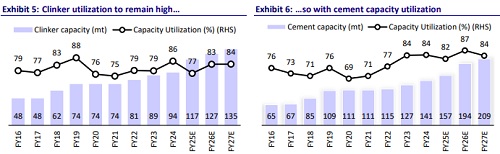
* UTCEM’s domestic grey cement capacity is likely to increase to 209.3mtpa (including Kesoram’s cement assets and ICEM) by FY27 from 165.7mtpa as of Dec’24 (including ICEM). The company plans to add 43.6mtpa between Jan’25 and FY27-end, with 32.8mtpa (~75%) coming organically and the remaining 10.8mtpa (~25%) inorganically.
* The company has achieved a balanced pan-India presence through consolidation and diversification. In FY15, UTCEM had a higher concentration in the West and South regions. However, through steady organic expansions, strategic acquisitions, and geographic diversification, the company has balanced its overall market presence across India.
* UTCEM’s capacity CAGR stood at ~10% over FY15-24, outperforming most of its peers, except SRCM. Despite significant capacity expansion, the company maintained higher capacity utilization compared to its peers. Over the same period, UTCEM’s market share increased 10pp to ~26%, the highest in the industry. We estimate UTCEM’s capacity/volume CAGR at ~14% (each) over FY24-27. Additionally, we project the company’s market share to increase to ~32% by FY27 from ~26% in FY24, led by its aggressive expansion strategy and focus on high-growth markets.
Cost-saving initiatives improving profitability
* Over FY17-19, UTCEM’s consolidated EBITDA/t was lower than that of SRCM/DALBHARA/TRCL, primarily due to the integration of newly acquired cement assets (which accounted for ~38% of the company’s total grey cement capacity during that period). However, over the years, the EBITDA/t gap narrowed, led by the leveraging of synergies, improvements in the manufacturing processes at the acquired assets, and the launch of the UTCEM brand at the plants of the acquired companies.
* At this time, the recently acquired cement assets will account for ~13% of the company’s total domestic grey cement capacity as of FY26E. We estimate the company’s blended EBITDA/t to be largely at par/higher than its peers over FY25-27. Further, we estimate Its cost reduction initiatives (targeting cost savings of INR300/t by FY27E) to help offset the impact of lower profitability from newly acquired assets during the initial years.
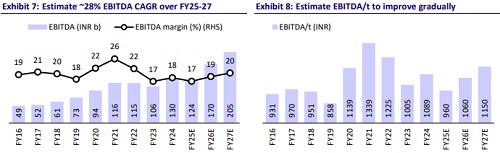
* We estimate UTCEM’s consol. revenue/EBITDA/PAT CAGR at ~17%/28%/32% over FY25-27. We estimate a consolidated volume CAGR of ~16%, aided by inorganic growth. We estimate its EBITDA/t at INR1,060/INR1,150 in FY26/FY27 vs. INR960 in FY25E (average of INR1,160 over FY20-24). We have included ICEM in the company’s consolidated earnings estimates starting from 4QFY25.
Strong cash flow generation and disciplined capital allocation
* UTCEM’s consolidated net debt increased to INR217b (net debt-to-EBITDA ratio was at 3.0x) following a series of acquisitions in FY19-20. However, through successful integrations and a rapid scale-up in capacity utilization, UTCEM not only reduced its net debt to INR27.8b as of Mar’24 (with net debt-to-EBITDA ratio at 0.2x), but also expanded its domestic grey cement capacity to 140.8mtpa in FY24 from 109.0mtpa in FY19, while maintaining its leadership position in the industry.
* Over the past three years, UTCEM’s expansion has been self-reliant, supported by strong cash flow generation (aggregate OCF stood at INR292b over FY22-24) and a disciplined capital allocation strategy (aggregate capex stood at INR206b over FY22-24). The company is also consistently paying dividends (~19-29% of PAT during FY22-24).
* Recently, the company’s net debt has increased to INR161.6b (after taking into consideration the cost of the open offer of INR31.42b, which will be paid on the 4 th/5th Feb’25, and ICEM’s net debt of INR8.8b). This increase is primarily driven by aggressive capacity expansion plans, investments in sustainable costreduction initiatives (WHRS, other RE capacities, and infrastructure development at plants to increase the AFR share), strategic investments, and lower profitability (as cement prices reached multi-year lows in 1HFY25).
* We believe the company’s leverage will remain low, considering the scale of operations, expected improvement in profitability, and a higher cash flow generation (estimate aggregate OCF of INR398b over FY25-27). We estimate net debt to decline to INR131b by FY27, with a net debt-to-EBITDA ratio at 0.6x.
View and valuation
* There are signs of recovery in cement demand after the festive season, and we anticipate industry volume to grow ~4% YoY in FY25, implying ~7-8% YoY growth in 4QFY25. This growth is expected to be driven by pent-up demand, a rebound in government spending, and robust demand in the real estate and housing sectors. Strong volume growth and improvements in clinker utilization (estimated to peak in 4QFY25) are expected to support price hikes across the industry. Being the largest player in the industry with a pan-India presence, we expect UTCEM to benefit from the cement demand recovery and price hikes.
* While we have factored in EBITDA margins of ~19/20% over FY26/27, lower than its average EBITDA margin at ~21% over FY20-24, there could be an upside risk to our EBITDA/t forecast, led by the higher-than-estimated price increase and an early integration of the recently acquired cement assets at par with UTCEM. The company’s large scale of operation, ability to outperform the industry’s growth rate, and self-reliance on organic expansions warrant higher multiples. We reiterate our BUY rating with a TP of INR13,800, valuing at 20x FY27E EV/EBITDA.

For More Research Reports : Click Here
For More Motilal Oswal Securities Ltd Disclaimer
http://www.motilaloswal.com/MOSLdisclaimer/disclaimer.html
SEBI Registration number is INH000000412