Buy Sagility India Ltd For Target Rs. 55 By Geojit Financial Services Ltd

Fundamental View
Sagility India Ltd. is a healthcare-focused, technology-enabled solutions provider, serving primarily U.S. health insurers (Payers) and, to a lesser extent, hospitals, physicians, and medical device companies (Providers). Headquartered in Bengaluru, it operates 33 centres across India, the U.S., and other global markets. In Q1FY26, 88.4% of revenue was derived from payers, with the remainder from providers.
* In Q1FY26, Sagility posted revenue of Rs.1,539cr, up 26% YoY, supported by steady growth across payer and provider segments. Operating EBITDA stood at Rs. 356cr with a 23% margin. Net profit rose 577% YoY to Rs.149cr, though it declined 19% sequentially.
* In Q1, Sagility secured $32mn in new contracts across 18 existing and 4 new clients. The BroadPath acquisition is expected to drive cross-selling opportunities and support growth. Management maintained its FY26 organic growth guidance in the low-to-mid teens, with overall growth projected above 20%.
* Cuts in U.S. Federal Medicaid funding pose challenges for Payers and Providers, though Sagility’s limited mid-single-digit exposure reduces risk. Growing Medicare utilization continues to favour outsourcing by Payers & Providers to manage costs. The management has increased FY26 EBITDA margin guidance, supported by automation, cost controls, and expected H2 strength.
* Sagility’s revenue outlook remains resilient, supported by a strong order pipeline, nondiscretionary spend focus, higher-margin offshore delivery, and seasonally stronger H2. The stock trades at 24x 1-year forward P/E, based on market consensus, which we believe is attractive given its niche business model in the BPO segment.
Technical View
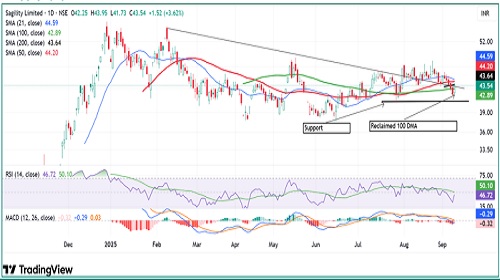
* Sagility India Ltd is trading at Rs.43.54, consolidating near the upper boundary of a downward-sloping trendline, signaling a potential breakout from the highs of January 2025 to recent peaks.
* Today's price action confirms this optimism, with the formation of a bullish candlestick pattern accompanied by a higher high and higher low structure on the daily chart. Additionally, the stock has reclaimed its 100-DMA, signaling a positive bias and reinforcing the potential for further upside.
* Momentum indicators further support this outlook. The RSI (14) is currently at 50, gradually rising and showing positive momentum, while the MACD is nearing a bullish crossover above its signal line, adding further weight to the breakout scenario.
* Given the improving price action and technical indicators, a buy call can be considered within the range of Rs.43-44, targeting a potential breakout from the resistance zone, with an optimistic outlook for further upside in the coming sessions.
For More Geojit Financial Services Ltd Disclaimer https://www.geojit.com/disclaimer
SEBI Registration Number: INH200000345

.jpg)