Buy Gujarat Gas Ltd For Target Rs. 535 By JM Financial Services
Operationally in-line result in a seasonally weak quarter
Gujarat Gas’ (GGas) 2QFY26 standalone EBITDA was INR 4.5bn, slightly above JMFe of INR 4.3bn (but below consensus of INR 4.9bn) due to slightly higher volume and EBITDA margin in a seasonally weak quarter. Overall volume was 2% above JMFe at 8.7mmscmd (though down 2.4% QoQ and down 1.0% YoY) led by industrial volume being 3.7% above JMFe while CNG volume was largely in line. PAT was also higher at INR 2.8bn vs. JMFe of INR 2.6bn (but below consensus of INR 2.9bn) aided by higher other income (at INR 3.1bn vs. JMFe of INR 2.9bn). Gross margin was a tad lower at INR 10.0/scm in 2QFY26 vs. JMFe at INR 10.1/scm led by higher gas cost; however, EBITDA margin was slightly better at INR 5.6/scm vs. JMFe of INR 5.5/scm, aided by tad lower opex. We maintain BUY (revised TP of INR 535) as we expect industrial segment volume growth to be robust in the medium to long term driven by likely strengthening of competitiveness of gas vs. propane on account of moderation in spot LNG prices in the medium to long term.
* Overall volume was 2% above JMFe at 8.7mmscmd led by industrial volume being 3.7% above JMFe while CNG volume was largely in line: Overall volume was 2% above JMFe at 8.7mmscmd in 2QFY26 (though down 2.4% QoQ and down 1.0% YoY) led by industrial volume at 4.35mmscmd being 3.7% above JMFe; this is against muted growth expectation for industrial volume in 2QFY26 due to decline in competitiveness of gas vs. propane and seasonal weakness in volume during the Jul-Sep quarter due to festival holidays. Domestic PNG volume was also slightly higher at 76mmscm (up 9% QoQ and up 22% YoY); commercial segment volume was also a little higher at 15mmscm (up 7% QoQ and up 16% YoY). CNG volume was largely in line with JMFe at 3.32mmscmd (up 0.8% QoQ and up 13.3% YoY).
* Gross margin a tad lower at INR 10.0/scm in 2QFY26 vs. JMFe at INR 10.1/scm led by higher gas cost; however, EBITDA margin was little better at INR 5.6/scm vs. JMFe of INR 5.5/scm, aided by slightly lower opex: The average realisation was higher at INR 47.4/scm vs. JMFe of INR 46.7/scm (vs. INR 48/scm in 1QFY26); however, average cost of gas was also higher at INR 37.4/scm or USD 11.9/mmbtu vs. JMFe of INR 36.6/scm (and vs. INR 37.2/scm or USD 12.1/mmbtu in 1QFY26). Hence, gross margin was a tad lower at INR 10.0/scm in 2QFY26 vs. JMFe at INR 10.1/scm (vs. INR 10.8/scm in 1QFY26). However, opex was also slightly lower than JMFe at INR 4.4/scm in 2QFY26 (vs. INR 4.3/scm in 1QFY26). Hence, EBITDA margin was a tad better at INR 5.6/scm in 2QFY26 vs. JMFe of INR 5.5/scm (and vs. INR 6.4/scm in 1QFY26).
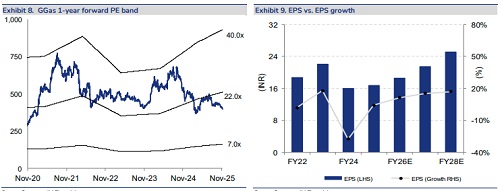
* Maintain BUY as we expect GGas’ competitiveness to improve due to likely moderation in spot LNG price over medium to long term on significant jump in global LNG supply: We have cut our FY26-FY28 PAT estimates by 2-4% due to moderation in volume, aligning with 1HFY26 results. Hence, our TP is cut to INR 535 (from INR 550). We maintain BUY as we expect volume growth momentum to sustain in the medium to long term led by: a) rise in gas use in the industrial segment driven by likely improvement in competitiveness of gas vs. propane (on account of moderation in spot LNG price supply over the medium to long term due to significant jump in global LNG from 2026-27 onwards), and also due to regulatory push; and b) expansion of CNG in new GAs and limited threat from electric vehicles. At CMP, GGas is trading at 18.7x FY27 P/E and 2.7x FY27 P/B. Key risks: a) sustained high spot LNG prices and fall in propane price could pose a competitive threat from propane; b) further sharp APM gas allocation cuts could pose a risk to margin/volume in the CNG business.
Please refer disclaimer at https://www.jmfl.com/disclaimer
SEBI Registration Number is INM000010361