Buy Greenply Industries Ltd For Target Rs. 425 By Choice Broking Ltd

Strong Rebound Ahead!
Impressive Volume Growth Ahead
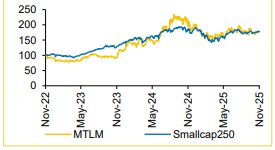
We maintain our BUY rating on Greenply Industries Ltd. (MTLM) with a target price of INR 425/Share. We continue to have a positive stance on MTLM owing to: 1) Expected volume CAGR of ~8.5% over FY25–28E for the Plywood segment (which exceeds industry growth forecast of ~7% CAGR over the same period) driven by market share gains from unorganised players, 2) Addition of 25% capacity and higher capacity utilisation resulting in 17.3% volume CAGR in MDF segment over FY25–28E, and 3) Revenue contribution from the new JV, BV Samet, from FY26.
Estimate: We forecast MTLM EPS to expand at a CAGR of 42.2% over FY25– 28E, on the basis of our volume/realisation CAGR assumption of 8.3%/1.5% for Plywood segment and 17.3%/2.4% for MDF segment. We forecast JV revenue of INR 1/1.5Bn over FY27/28E.
Valuation: We arrive at a 1-year forward TP of INR 425/share for MTLM. We value MTLM on our PEG ratio-based framework – we assign a PEG ratio of 1x on FY25–28E core EPS growth of 42%, which we believe is a conservative multiple. This valuation framework gives us the flexibility to assign a commensurate valuation multiple based on quantifiable earnings growth. We did a sanity check of our PEG ratio-based TP using implied EV/EBITDA, P/BV and P/E multiple. On our TP of INR 425, FY28E implied EVEBITDA/PB/PE (x) is 15.8x/4.8x/26.0x, which is reasonable in our view.
Risks: Potential slowdown in real estate and home improvement activities and possible higher timber cost are risks to our BUY rating.
Q2FY26: Strong Plywood segment performance overshadows weak MDF segment margin
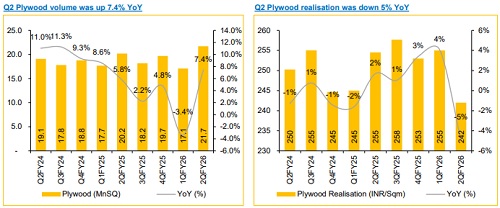
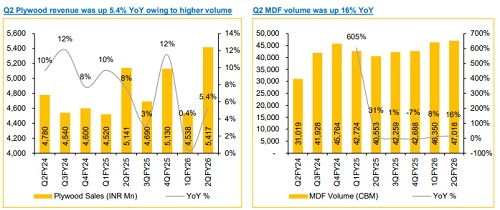
Plywood Segment: Q2FY26 volume came in at 21.7Mn SQM (+7.4%/+26.9% YoY/QoQ) vs Choice Institutional Equities (CIE) estimate of 20.0Mn. Realisation at INR 242/SQM is down 4.9%/5.1% YoY/QoQ vs. CIE estimate of INR 255/SQM. As a result, revenue grew by 5.4% YoY to INR 5,417Mn (including other related products revenue of INR 170Mn) vs CIE estimate of INR 5,100Mn. EBITDA margin came in at 8.2% (-10bps/+30bps YoY/QoQ), which is higher than CIE estimate of 7.9%. Overall, Plywood segment performance was stronger than expected owing to higher volumes and better margin. The management expects H2FY26 to be better than H1FY26 and is confident of achieving 10% volume growth and EBITDA margin of 10+%.
MDF Segment: Q2FY26 volume came in at 47,018 CBM (+15.9/1.4% YoY/QoQ) vs. CIE estimate of 44,203 CBM, which is encouraging. Realisation came in at INR 31,222 CBM (+0.1% YoY) vs. CIE estimate INR 31,780 CBM. Revenue came in at INR 1,468Mn (+16.0/-0.3% YoY/QoQ) vs. CIE estimate of INR 1,405Mn. EBITDA margin disappointed at 8.3% (-350/-910bps YoY/QoQ) vs. CIE estimate of 16.0%. However, the margin dip is due to one-off reasons (plant shutdown and more reliance on trading, etc). Management expects a strong rebound in margin for H2FY26. It is confident of achieving double-digit volume growth for FY26 and a margin of 16%+ for H2FY26, driven by increased sales of value-added products. MDF capacity increased to 1000 CBM/day from 800 CBM/day in Q2FY26.
Overall, Q2FY26 revenue/EBITDA came in at INR 6,886Mn (+7.5%/14.6% YoY/QoQ)/INR 568Mn (-1.5%/-7.9% YoY/QoQ) vs CIE estimate of INR 6,505/628Mn, respectively. EBITDA margin at 8.2% is down 75.3bps YoY (CIE estimate of 9.6%), mainly due to lower margin in the MDF segment.
For Detailed Report With Disclaimer Visit. https://choicebroking.in/disclaimer
SEBI Registration no.: INZ 000160131