Buy Aadhar Housing Finance Ltd For the Target Rs. 625 by ICICI Securities Ltd
Strong asset quality performance amid challenges; maintain full-year FY26 growth guidance
Aadhar Housing Finance’s (Aadhar) credit discipline, robust risk management and geographically diversified AUM (no state has <15% of AUM) helped it in delivering one of the best asset quality performances in Q2FY26 despite challenges. Stage 2 assets moderated to 3.5% vs. 3.7% QoQ, 30+ DPD fell 5bps QoQ to 4.6%, and credit cost moderated sharply to 19bps vs. 41bps QoQ. Management attributes this to its low exposure in some stress pockets like Tirupur, Coimbatore, Surat (combined exposure is ~1.6-1.7% of total AUM as on Sep’25) and robust collection mechanism (total 1,500 collection people). Notably, disbursements growth remained strong at 16% YoY during H1FY26 and it maintained its full-year FY26 disbursements growth target of 18-20% YoY.
Its ability to deliver strong growth with industry-leading spreads, despite being one of the largest AHFCs, reinforces our view that Aadhar is well placed to maintain industry-leading position within AHFC space. Its Q2FY26 financial performance reflects its steady progress towards its strategic priorities by sustaining >20% YoY AUM growth, continued investment towards franchise build-up (added 11 new branches) and tight control over credit cost. The same enabled it in maintaining average ~16% RoE during the past six quarters despite industry-level headwinds. Its judicious strategy of splitting the distribution network (first to implement amongst AHFC) to sustain growth/spread and deliver 16–17% RoE sets Aadhar apart from peers. Retain BUY with an unchanged TP of INR 625, valuing the stock at ~3.2x Sep’26E BVPS.
First full quarter of segmented distribution
In order to sustain >20% YoY AUM growth and maintain spread at >5.5%, Aadhar has spilt its branch network into two segments – 1) top 15 cities to be categorised as urban market and 2) rest of India categorised as emerging market during Q1FY26. Incremental yield in urban market is 12–12.5%; the figure in emerging market is as high as 14.5–16%. At the time of distribution spilt - ~55% of the business came from urban market and the rest 45% came from emerging. Management highlighted that it plans to improve emerging market business share to 50% in the near term and the progress during Q2FY26 is on track.
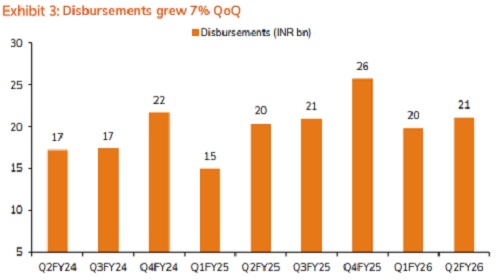
H1FY26 disbursements growth stood at 16% YoY; expects 20–22% YoY AUM growth in FY26
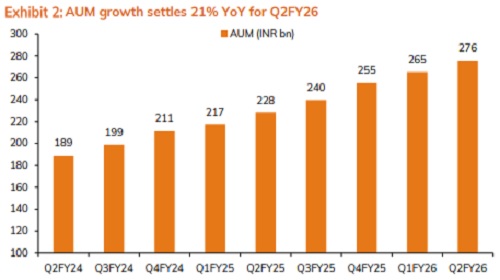
Despite industry-level headwinds, many mortgage players have been highlighting stress in a few pockets like TN, KTK and GJ; Aadhar sustains growth momentum with 16% YoY disbursement growth during H1FY26. However, sequentially growth appears muted at 4% YoY given the base quarter (Q2FY25) had higher disbursements due to spillover of Q1FY25 disbursements to Q2FY25 post the regulatory circular dated 29th Apr’24 (stabilising of cheque handover). Sustained traction in disbursements led to Aadhar delivering robust 21% YoY/4% QoQ AUM growth during Q2FY26. The same was supported by lower BT out at 5.4% during H1FY26 vs 5.9% in H1FY25. Contrary to the industry commentary of the MSME segment witnessing stress, Aadhar highlighted that portfolio quality of its LAP segment remains strong with bounce rate, 30+ DPD staying flat QoQ. LAP grew 28% YoY during Q2FY26. Notably, it maintained its full-year FY26 guidance of 20–22% AUM growth and 18–20% YoY disbursements growth. An early entry into the under-penetrated markets such as UP, MP, Chhattisgarh, Jharkhand complemented by focus on diversification with one of the largest distribution networks of 611 branches, as on Sep’25, have been key growth enablers.
RoA expanded 30bps QoQ to 4.3% largely driven by credit cost moderation and spread expansion
Aadhar’s RoA has sustained at or above 4% for seven consecutive quarters; in Q2FY26, the same expanded 30bps to 4.3% vs. 4% QoQ with PAT at INR 2.66bn, up 17% YoY / 12% QoQ. Credit cost moderation to 19bps vs. 41bps QoQ and 10bps QoQ spread expansion were key earnings drivers during Q2FY26. NII was up 7% QoQ/18% YoY, while other income too grew strong 9% QoQ, resulting in total income growing by 7.4% QoQ during Q2FY26. Other income was mainly boosted by higher DA income at INR 441mn vs. INR 325mn QoQ. Opex was well calibrated with cost-income ratio remaining flat QoQ at 36% during Q2FY26. As a result, operating profit inched up 7% QoQ/16% YoY. Credit cost (calculated), as a % of average AUM, fell to 19bps vs. 41bps QoQ vs. 24bps YoY. Recoveries of INR 60-80mn from earlier written-off developer loans drove provision lower in Q2FY26. It also highlighted that cumulative write-off stands at INR 250mn as on Sep’25 from which it expects to recover a meaningful amount in next 2-3 years. While GNPA on AUM inched up to 1.42% vs. 1.34% QoQ, stage 2 assets fell 20bps QoQ to 3.5% during Q2FY26
Spread expanded (up 10bps QoQ) for second consecutive quarter; full year FY26 spreads to remain in a narrow band of 5.7–5.8%
Aadhar’s initial focus, on scaling its affordable housing finance business in relatively credit-untested markets such as UP, Chhattisgarh, Jharkhand and Odisha, provided it with strong pricing power. Further, an increased share of LAP to 27% by Q2FY26, from 14% in FY20, also supported spreads given the yields in LAP were much higher at ~17% vs. ~12.5% in housing loan. This inherent advantage helped it sustain industryleading spread at >5.5% despite being one of the largest AHF players. Spreads inched up 10bps QoQ to 5.9% aided by a 10bps QoQ improvement in borrowings cost while yields remained flat QoQ at 13.8% during Q2FY26. However, it is still the highest among peers. Cost of borrowing stood at 7.9% and it expects another 30-40bps reduction in CoF by Q4FY26. However, it plans to pass-on the benefit of lower CoF to borrower by revising PLR lower, and hence, it expects spreads to sustain in a narrow range of 5.7-5.8% in FY26. In order to sustain spreads over a long period, management adopted a strategy of branch categorisation into urban and emerging. In line with this, Aadhar has separated its pan-India distribution into four parts – urban (137 branches) and rest 474 branches in Emerging A-B-C. Asset yield in urban locations is ~12% while yield in emerging markets is 14–16%. Currently, urban locations contribute 55% of AUM while emerging locations contribute 45% of AUM. The company plans to increase emerging market’s share to 50% over the next two years.
Except for a major part of its non-housing book and loans benchmarked via NHB borrowings, all of Aadhar’s assets are floating in nature, which is ~75% of assets. Similarly, on liability side, ~73% of its borrowings are floating in nature. Hence, it may be inferred that Aadhar does not take interest rate risk and the company would be largely immune to changes in repo rate with respect to margins; except for a likely quarter of lead-lag in pricing its assets vs. liabilities.
Negligible exposure to stress pockets drove better asset quality outcome during Q2FY26
The most preferred customer segment for NBFCs in any asset class – vehicle, LAP, gold, home loan etc. – is the self-employed segment. Within affordable housing too, most players are catering to the self-employed segment. However, Aadhar challenged the status quo and targeted the formal salaried segment (non-white collar), but in under-penetrated markets. While mainstream banks were actively serving the formal salaried segment, Aadhar’s focus was more on high-ticket loans, mainly in metro and tier-1/2 cities. Hence, Aadhar chose to serve the salaried segment beyond tier-2 cities – it focuses more on low-ticket loans (
Post a strong Q4FY25, Aadhar’s asset quality metrics were weak in Q1FY26 due to seasonality. However, in line with its historical trend, asset quality improved during Q2FY26. This is despite industry-level headwinds with many mortgage players highlighting stress in pockets like TN (tariff-related challenges in area like Chennai, Tirupur, Coimbatore), GJ (mostly Surat) and KTK (e-khata) and over-leveraging at the bottom-of the pyramid leading to stress in small-ticket LAP (
In terms of PCR, it was stable sequentially at 0.3% for stage-1, but improved to 34% vs. 33% QoQ for stage-3 assets and ~10bps QoQ to 13.19% for stage-2 assets. Overall, it holds 1.25% ECL provisions on total assets.
Cost-income ratio remained flat QoQ; added 20 new branches in Q2FY26
Cost to income ratio saw a spike to 37.8% in Q4FY25 due to elevated costs, post which it moderated to 36% in Q1FY26 and it remained at similar level in Q2FY26. In FY25, cost to income ratio fell to 36.4% vs. 37.5% in FY24. Similarly, going ahead, management sees productivity improvement, while incremental branch addition in low-cost emerging branches and stable NII should aid another 30–50bps YoY reduction in cost-income ratio during FY26.
In terms of branch expansion, Aadhar has been consistent in expanding its network – has added 66 new branches in past 12 months, taking the total to 611 (added 20 branches in Q2). Until FY28, management aims to maintain a similar branch opening count of 50–60, of which 65–70% of new branches shall be opened in emerging markets and the rest would be in urban locations. Until FY28, management has a target of surpassing a branch count of 750.
Cost for emerging branches would be lower, which should help the company in containing cost in FY26. This branch network also goes in line with its diversification, wherein no single state currently accounts for >15% of AUM; Aadhar is the only AFHC with presence in 22 states and union territories
Key risks: 1) Slower-than-expected AUM growth; and 2) spreads coming under pressure due to competition.
For More ICICI Direct Disclaimer http://icicidirect.com/disclaimer.html
SEBI Registration number is INZ000183631