Top Conviction Ideas : Metals & Mining: Q2FY26 Review by Axis Securities Ltd
Q2FY26: Solid Operational Performances Amidst Volatile Macro Environment
Financial Performance
* For Aluminium companies under our coverage:
* Hindalco’s Indian operations stood robust, offsetting Novelis's muted profitability. Consolidated Revenue stood at Rs 66,058 Cr (up 13%/3% YoY/QoQ), largely in line with our estimate. EBITDA stood at Rs 8,976 Cr (up 12%/11% YoY/QoQ), in line with our estimate (8% beat vs consensus), led by strong aluminium performance.
* NALCO reported a strong set of numbers. Consolidated revenue stood at Rs 4,292 Cr (up 7%/13% YoY/QoQ), a 10% beat vs. consensus estimate. EBITDA stood at Rs 1,926 Cr, up 24%/29% YoY/QoQ, 30%/22% ahead of consensus/our estimate, mainly led by higher Alumina sales. NALCO delivered superior cost control with RM, employee, and power costs under control.
* For Steel companies under our coverage:
* Tata Steel reported a strong set of consensus-beating numbers. Consolidated revenue stood at Rs 58,689 Cr, up 9%/10% YoY/QoQ (5% beat vs consensus), led by higher sales volumes. Consolidated EBITDA stood at Rs 8,968 Cr, up 62%/20% YoY/QoQ, led by higher operating leverage on higher volume, partly offset by lower sales realisations. India EBITDA/t stood at Rs 14,863/t, down 2% QoQ (but up 13% YoY) due to higher RM on higher production and purchases of rebars from NINL. Europe EBITDA/t at $8/t flat QoQ from loss of $75/t in Q2FY26. Net debt stood at Rs 86,000 Cr, slightly up by 3% QoQ.
* Financial Performance
* SAIL’s EBITDA stood ahead of the consensus. Revenue (excluding railway provisions) stood at Rs 26,704 Cr (up 8%/4% YoY/QoQ), largely in line with our estimate, but stood ahead of consensus by 7%. Adjusted EBITDA (excluding railway provision) stood at Rs 2,528 Cr, down 13%/3% YoY/QoQ, a significant 28% beat against the consensus estimate. This beat was driven by higher NSRs, supported by higher byproduct sales (steel scrap/slag, etc) and robust sales volumes.
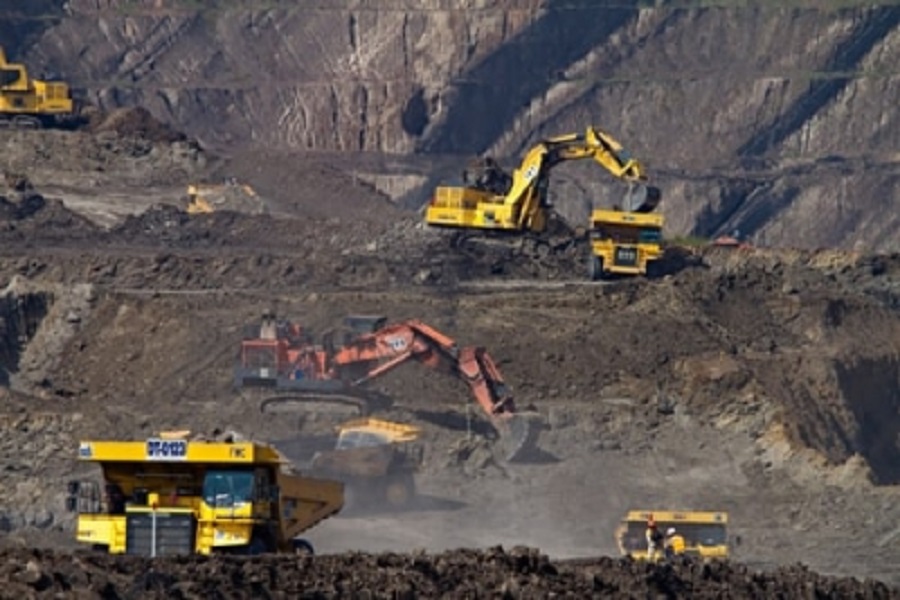
* Coal India reported a weak set of numbers, as was anticipated. Revenue stood at Rs 30,187 Cr, down 2%/16% YoY/QoQ (in line with our estimate). EBITDA excluding stripping activity stood at Rs 5,845 Cr, down 18%/47% YoY/QoQ, 15% below our estimate. The miss against our estimate was due to higher raw material costs, contractual expenses and other expenses, partly offset by lower employee expenses.
* APL Apollo Tubes posted a decent set of numbers amidst a tough macro environment in Q2FY26. Revenue grew by 9%/1% YoY/QoQ, missing consensus by ~8%. EBITDA stood at Rs 447 Cr, up 224%/20% YoY/QoQ, an 8% beat against consensus. EBITDA/t stood at Rs 5,228/t, up 187%/12% YoY/QoQ, 8% above consensus. The strong EBITDA/t was led by positive operating leverage on account of higher sales volumes and expansion in margins.
* JTL’s sales volume at 81.6kt (down 10%/19% YoY/QoQ) was impacted due to floods in Punjab (net impact of ~20kt), despite that EBITDA and EBITDA/t both improved YoY/QoQ by 16%/48% and 29%/83%, respectively, at Rs 35 Cr and at Rs 4,247/t in Q2FY26, led by better product mix.
* Steel Spreads Likely to Remain Muted in Q3FY26: Steel spreads on a consumption basis are likely to fall by 7% QoQ in Q3FY26 if the spot HRC prices do not inch up in the remaining Q3FY26. So far, steel HRC prices are down by ~4% QoQ in Q3FY26. In Q2FY26, NMDC iron ore prices for lumps and fines fell 5%/4% YoY/QoQ, respectively; however, coking coal prices rose 3% QoQ. Consequently, the spreads are expected to come under pressure as the iron ore and coking coal prices in Q2 will be consumed in Q3FY26 (1 quarter lag).
* Domestic HRC Prices are Now Trading at a 12% Discount to Landed Chinese HRC Prices: In Q3FY25, so far, Chinese domestic HRC prices have remained almost flat and averaged at $481/t against the Q2FY26 average. However, it's not reflected in domestic HRC prices yet, which have now declined by 4% over the same period and averaged at Rs 48,722/t. This is on account of higher steel mills volumes led by more steel capacity coming online in Q2FY26. India’s finished steel production grew by 12%/6% YoY/QoQ, while steel consumption grew by 8%/6% YoY/QoQ, indicating adequate supply to fulfil the demand, thereby keeping the prices under check. Also export market is weak (exports run rate down from earlier 7-10 Mt per annum), leading to higher domestic sales, which is putting pressure on domestic steel prices. Exports in FY25 declined to 4.9 MT from 7.5 MT in FY24. India remained a net steel importer in the Apr-Oct’25 period. Net imports stood at 3.8 MT over this period, exceeding exports of 3.45 MT, resulting in net imports of 0.35 MT. The export run rate on an annualised basis is still below the earlier 7-10 MT per annum due to competitive Chinese HRC offers. China steel exports have stood elevated at 97.8 MT, up 6% YoY in the 10MCY25.
* Steel Raw Material Prices: Coking coal prices FOB Australia remained soft at $189/t in Q2FY26, down 23% YoY, but up marginally by 2% QoQ, while iron ore prices inched up in Q2FY26 and averaged at $100/t, CFR China, up 5% QoQ and flat YoY. Spot coking coal and iron ore prices are currently trading at $199/t and $101/t, respectively.
* Key Monitorables: More China stimulus measures, safeguard duty approval/extension (initial safeguard duty of 12% imposed in Apr’25 for 200 days as a provisional measure), the impact of 50% tariffs (25% base +25% from 4 th June, 2025) on steel imports in the US, and China’s steel production cuts will be the key monitorables in future.
* Aluminium Q2FY26: LME aluminium prices rose 10%/7% YoY/QoQ at $2,621/t in Q2FY26, driven by resilient demand, a weaker US dollar, and Fed rate cut outlook. Demand is resilient in the packaging and electrical sectors across the US and Europe, offsetting continued softness in construction and transportation, though tariff uncertainty remains a key factor. Supply growth in CY25 is limited, with moderate restarts outside China, while China approaches its smelter capacity cap of 45 mtpa. In 2026, new supply from Indonesia is anticipated; however, its impact on prices could be limited as potential disruption at the Mozal smelter adds a layer of supply risk, along with broader capacity constraints and resilient global demand, ensuring that overall market balance remains tight.
* Aluminium Supply/Demand Balance: For CY25, as per Norsk Hydro Q3CY25 ppt, the primary Aluminium global balance is expected to remain in a deficit of 0.1MT.
* Impact of Tariffs on Aluminium: Tariffs impacted both LME and physical premiums significantly. US premiums have increased strongly (US Midwest duty paid currently at $1,794/t), while the rest of the world premiums showed mixed movement in anticipation of diverted US-flows and weaker overall demand in 2025. The Midwest premium neared import parity as US inventories declined, and European premiums rebounded from Q1FY26 lows.
* Alumina prices (FOB WA) averaged at $361/t in Q2FY26, down 29% YoY (flat QoQ), due to high spot availability from refinery expansions in both Indonesia and China. China has restarted most of its curtailed capacity since May’25. The demand outlook is supported by Indonesian smelting capacity expected to come online from late 2025 into 2026, which will eventually absorb the increased alumina supply; however, this positive demand signal is tempered by the downside risk presented by the uncertain future and potential shutdown of the Mozal smelter in 2026, which poses a threat to demand and pricing in that year.
For More Axis Securities Disclaimer https://simplehai.axisdirect.in/disclaimer-home
SEBI Registration number is INZ000161633


