MOSt Quantitative Outlook Monthly by Motilal Oswal Wealth Management

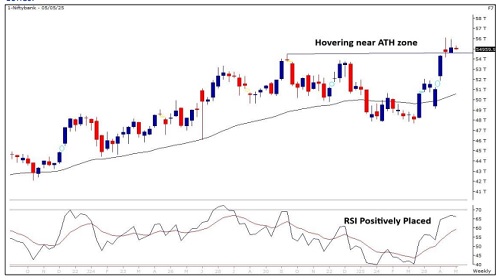
Bank Nifty
Bank Nifty outperformed the broader market in April as it made a fresh all-time high of 56,098. The first week of the month was marked by higher volatility, with the index testing levels close to 49000. However, bulls made a strong comeback, supported by heavyweights leading to a sharp rally of over 5000 points. Price observation of the last couple of weeks suggests that a hold above 54250 zones could move the index higher towards 56000 then 56500 zones while on the downside, supports are shifting higher at 53850 then 53000 zones.
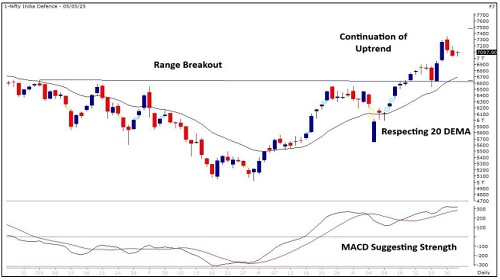
Nifty India Defence Index
Nifty India Defence Index is in an overall uptrend and is respecting its 20 DEMA support zones. It has given a rounding bottom pattern breakout on the daily chart which suggests a continuation of the bullish trend. THE MACD indicator is positively placed which confirms the upward momentum. Thus, looking at overall chart setup we are expecting the sector to head towards 7455 and 7600 zones while on the downside support is at 6885 and 6745 levels.
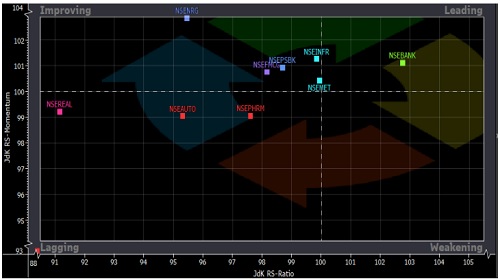
Relative Rotation Graphs(RRG):
Relative rotation graphs chart shows the relative strength and momentum for group of Stocks/ Indices. It allows us to compare a security against the benchmark to see if it is outperforming or underperforming the benchmark. It is derived on Relative strength in which value of a sector is divided by the value of index mainly a benchmark which allows us to compare the performance of the sector. Relative Strength ratio is normalized to oscillate around 100 (plotted on X axis) i.e Jdk RS- Ratio along with this it provides the speed and direction of the Relative strength ratio (plotted on Y axis) i.e Jdk RS- momentum. The scatter plot is divided into four quadrants i.e Leading , Weakening quadrant, Lagging and Improving quadrant..
The analysis of sectorial RRG shows that Nifty Bank is in the Leading Quadrant which indicates strength going ahead. Nifty IT, Pharma, Realty, and Auto are inside the Lagging quadrant which shows strength and momentum both are missing. Nifty Energy, Metal, FMCG, PSU Banks and Infra are under Improving quadrant which suggests strength is still low but momentum will start Improving.
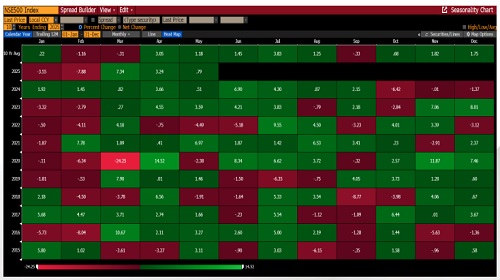
Seasonality Chart - Nifty 500
Seasonality in markets refers to the tendency of stocks or indices to exhibit recurring performance patterns during specific months or periods of the year. It's based on historical data and helps traders anticipate likely trends. April consistently shows strong positive returns in most years (e.g. 2024: +3.66%, 2023: +4.55%), making it one of the most bullish months historically. May generally also shows a mild positive bias, although less consistent than April. Implication: April is a seasonally strong month, often suitable for initiating long positions. May is moderately bullish but more variable, suggesting caution or selectivity in stock picking.
Nifty IT Index
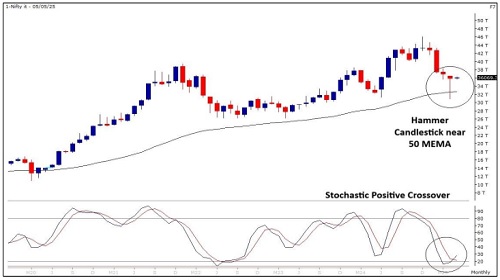
Nifty IT Index has formed a hammer candlestick on the monthly scale and bounced up from its 200 EMA on the weekly chart which confirms the trend reversal. The stochastic indicator has exited the oversold zone and turned positive which confirms the bullish price action. Thus, looking at overall chart setup we are expecting the sector to head towards 38000 and 38700 zones while on the downside support is at 35000 and 34350 levels.
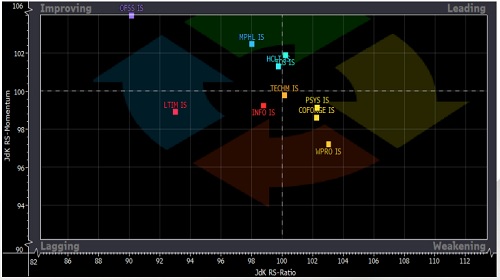
RRG For Nifty IT
The analysis of RRG for IT Index shows that Hcltech is in the Leading Quadrant which indicates strength going ahead. TechM, Persistent system, Coforge, and Wipro are under weakening quadrant which suggests momentum is likely to decline. LTIM, and Infy are inside the Lagging quadrant which shows strength and momentum both are missing. OFSS, Mphasis, and TCS are under Improving quadrant which suggests strength is still low but momentum will start Improving.
Nifty Energy Index
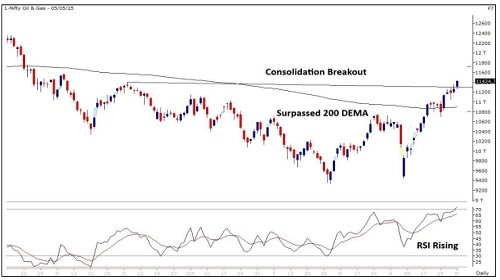
Nifty Oil & Gas Index has broken out of a consolidation on the daily scale and has surpassed above its 50 EMA on the weekly time frame which could support the bullish trend. The RSI momentum indicator is rising which confirms the positive sentiment. Thus, looking at overall chart setup we are expecting the sector to head towards 12000 and 12250 zones while on the downside support is at 11000 and 10850 levels.
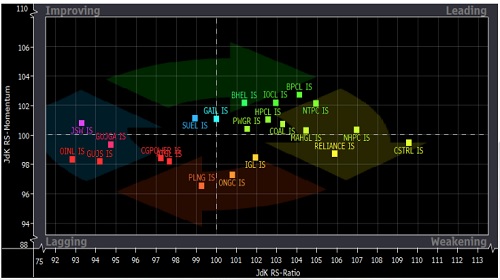
RRG For Nifty Energy
The analysis of RRG for Energy Index shows that BHEL, IOC, BPCL, HPCL, Powergrid, NTPC, Coal India, MGL, and NHPC, are in the Leading Quadrant which indicates strength going ahead. Reliance, IGL, and ONGC are under weakening quadrant which suggests momentum is likely to decline. Petronet LNG, CG Power, Gujgas, Oil India, and GSPL are inside the Lagging quadrant which shows strength and momentum both are missing. JSW Energy and Gail are under Improving quadrant which suggests strength is still low but momentum will start Improving.
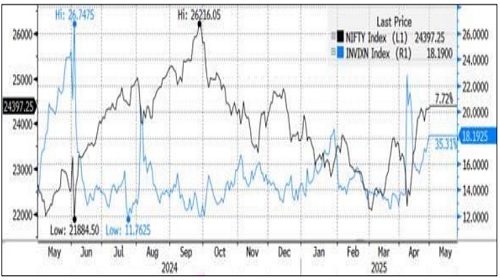
India VIX
India VIX Increased by 43.29% from 12.71 to 18.22 levels in the April month. Volatility spiked above 23 levels which caused some volatility in the beginning and later cooled to settle lower
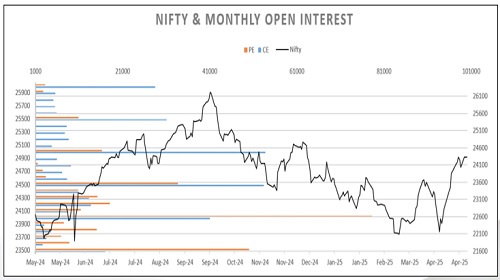
Nifty OI V/S Price
Nifty index started the series with a dip to 21750 zones in the first half but was followed by a strong comeback of the bulls and recovered by more than 2600 points in three weeks. Put Call Ratio based on Open Interest of Nifty started the series near 0.92 and oscillated in between 0.72 to 1.22 levels and ended the series to close near 0.94. On option front, Maximum Call OI is at 24500 then 25000 strike while Maximum Put OI is at 24000 then 23000 strike. Call writing is seen at 25000 then 24800 strike while Put writing is seen at 24000 then 23500 strike. Option data suggests a broader trading range in between 23200 to 25200 zones while an immediate range between 24000 to 25000 levels.
For More Research Reports : Click Here
For More Motilal Oswal Securities Ltd Disclaimer
http://www.motilaloswal.com/MOSLdisclaimer/disclaimer.html
SEBI Registration number is INH000000412


More News
Nifty immediate support is at 24350 then 24200 zones while resistance at 24700 then 24850 zo...