Buy Nuvama Wealth Ltd for the Target Rs. 9,100 by Motilal Oswal Financial Services Ltd

Transactional revenue improves CIR; 9% PAT beat
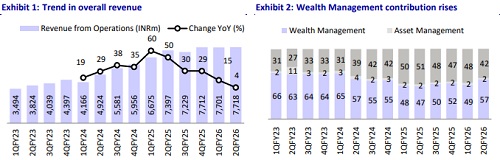
* Nuvama Wealth’s (NUVAMA) 2QFY26 operating revenue at INR7.7b grew 4% YoY, with the Wealth/Private/Asset services businesses growing 19%/37%/5% YoY in 2QFY26, while AMC/Capital markets business declined 21%/28% YoY. For 1HFY26, revenue grew 10% YoY to INR15.4b.
* Total operating expenses grew 12% YoY to INR4.4b (in-line), with 8% YoY growth in employee expenses and 23% YoY growth in other opex. The cost-to-income ratio increased YoY to 56.6% in 2QFY26 vs. 53% in 2QFY25 (our est. of 58.9%).
* Better-than-expected CIR led to a 9% beat in PAT to INR2.5b (flattish YoY). PAT margin came in at 32.9% in 2QFY26 vs 34.8% in 2QFY25. For 1HFY26, PAT grew 8% YoY to ~INR5.2b.
* Management maintained its PAT growth outlook of 20-25%, supported by the normalization of the loss of client impact on asset services expected over the next 3-5 months and sustained flow momentum in wealth.
* We have increased our earnings estimates for FY26E/27E/28E by 5%/3%/3%, considering the higher transaction revenue and higher retention in the asset services business, keeping our MPIS/ARR revenue estimates largely intact. We expect a 15%/16% revenue/PAT CAGR for FY25-28E. Reiterate BUY rating on the stock with a TP of INR9,100 (based on SOTP valuations).
Retention improves in wealth; transactional boost to private segment
Nuvama Wealth (31% of total revenue)
* Revenue was up 19% YoY to INR2.4b (5% beat), driven by 74% YoY growth in Managed Products and Investment Solutions (MIPS), constituting ~62% of the mix. This was offset by 11%/37% YoY decline in interest/brokerage income.
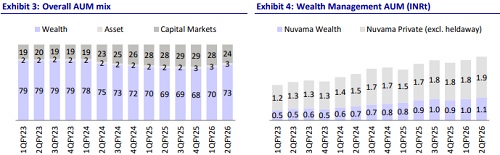
* Average client assets grew 12% YoY to ~INR1.1t, driven by all-time high net new money of INR38b and offset by MTM losses. In 1HFY26, MPIS contributed net flows of INR46.8b (+34% YoY) out of total net flows of INR66.6b.
* The segment has ~1.3m clients serviced by an RM base of ~1.1k and ~7k external wealth managers (26% of revenue by external wealth managers).
* CIR for the quarter remained stable YoY at 65% (vs our est. of 65.5%), resulting in an operating PBT of INR843m (+19% YoY; 6% beat).
* Retention improved YoY to 90bp from 85bp in 2QFY25.
Nuvama Private (25% of total revenue)
* Revenue grew 37% YoY to ~INR2b (17% beat), driven by 66% YoY growth in transactional revenue to INR1b (64% beat), while ARR revenue grew 15% YoY to INR957m (10% miss).
* The average client assets rose 9% YoY, with 27% YoY growth in ARR assets to INR497b and 8% YoY growth in transactional assets to INR1.4t. Net new money flowing into ARR assets stood at INR22.7b.
* The segment services 4,500+ families with 140+ RMs.
* CIR improved by 40bp YoY to 66.3% (vs our est. of 67.5%), resulting in 38% YoY growth in operating PBT to INR663m (22% beat).
* Retention declined YoY to 76bp from 84bp in 2QFY25.
Nuvama AMC (2% of total revenue)
* Revenue declined 21% YoY to INR136m (29% miss), largely owing to a 43% YoY decline in the private market management fee, while the listed equities management fee grew 51% YoY.
* Fee-paying AUM represents 93% of closing AUM. Average fee-paying AUM grew 56% YoY to INR110b. Net new money of INR3.7b was largely driven by the real estate JV (INR5.1b), as private market flows were low at INR0.3b and listed equities witnessed an outflow of INR1.6b.
* Retention for private markets declined YoY to 56bp, while for listed equities, it was stable at 63bp. Real estate retention stood at 77bp for 2QFY26.
* Operating loss for this segment increased to INR87m. Including the PBT contribution from the real estate JV, operating loss was INR78m.
Nuvama Asset Services and Capital Markets (42% of revenue)
* Asset services revenue grew 5% YoY to INR 1.6b (14% beat), driven by an improvement in retention to 2.6bp (1.4bp in 2QFY25).
* The average assets under clearing declined 46% YoY to INR241b. The segment currently services over 250 clients.
* The capital markets revenue declined 28% YoY to INR1.6b (17% miss), largely due to a moderation in secondary market volumes.
* CIR for the segment stood at ~40% (vs our est. of 47%), resulting in an operating PBT of INR1.9b (16% YoY decline; 10% beat).
Highlights from the management commentary
* During the quarter, the firm leveraged syndication opportunities arising from its commercial real estate fund, which supported growth in transactional revenue, a trend expected to continue in the second half, with INR700m-800m transactional revenue/quarter expected.
* Management indicated that the proposed SEBI consultation on brokerage could have an INR200m-INR250m top-line impact on the IE business if no research fee is charged. However, this could be offset if brokerage stabilizes at 5-6bp rather than the proposed 2bp, mitigating potential downside.
* For FY26, management guided for opex growth of around 8-10%, with roughly half attributed to inflationary increases (4–5%) and the remainder to business expansion, branch additions, and space allocation for the upcoming mutual fund business.
Valuation and view
* NUVAMA has reported decent performance in 2Q despite the loss of a large client in the asset services business, backed by maintained momentum in the wealth management business and client additions in the asset services business. With the expectation of asset services business recovering to pre-client loss levels in the near-term, sustained revenue momentum in wealth management, and a stable cost trajectory, we expect 15%/16% revenue/PAT CAGR for FY25- 28E.
* We have increased our earnings estimates for FY26E/27E/28E by 5%/3%/3%, considering higher transaction revenue and higher retention in the asset services business, keeping our MPIS/ARR revenue estimates largely intact. Reiterate BUY rating on the stock with a TP of INR9,100 (based on SOTP valuations).
For More Research Reports : Click Here
For More Motilal Oswal Securities Ltd Disclaimer
http://www.motilaloswal.com/MOSLdisclaimer/disclaimer.html
SEBI Registration number is INH000000412