Buy Mahindra & Mahindra Ltd for Target Rs. 3,539 - PL Capital
Quick Pointers:
* Achieved leadership position in revenue market share in E-SUV business
* Thar Roxx and 3XO to see capacity increment of ~1.5k each
M&M’s Q4FY25 Standalone revenue grew by 24.5% YoY, coming in 2.3%/4.4% higher than PLe/consensus estimates. The growth in revenue was aided by strong volume growth in in Auto and Farm division as well as better mix in the automotive division led its realizations to increase by 6.2% YoY while Farm realizations remained flat, blended realization up by 4.4% YoY. Gross profit grew by 20.4% YoY while margin contracted by 89bps YoY. EBITDA grew by 42% YoY while margin expanded 184bps YoY, owing to lower staff cost and other expenses in proportion to sales as compared to the same period last year. Adj PAT (adjusting for loss in JV and subsidiaries) increased by 48.8% YoY.
Going ahead, the company expects tractor industry volume growth to be in mid-single digit while the outlook for SUV business including the e-SUV portfolio remains pretty strong from the company. M&M’s execution has been quite impressive across core categories with robust margins as well as market share expansion in farm business and revenue market share expansion in the UV business. In CY26, the company aims to launch 7 products including 2 mid-cycle updates in the SUV portfolio and has further product intervention by FY30 which paves way for further growth. Factoring this, we estimate its revenue/EBITDA/PAT to grow at a CAGR of 12%/11%/10% over FY25-27E. We retain our ‘BUY’ rating with a TP of Rs3,539 (previous Rs3,218) valuing it at 27x on its Mar’27E core EPS and Rs229 for its EV business and Rs379 for its listed subsidiaries.
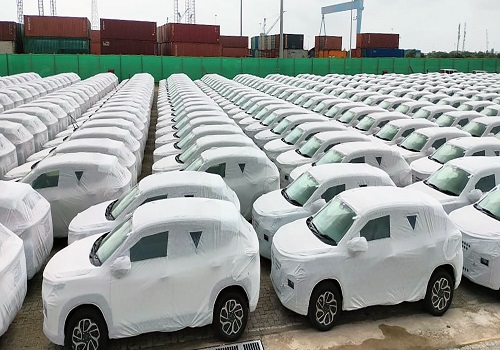
Beat in topline estimates led by better mix: Automotive division volume grew by 17.5% YoY driven by strong UV sales. Consequently, revenue grew by 24.8% YoY to Rs250bn (PLe: Rs240.4bn), while realization increased by 6.2% YoY to Rs 987,071/unit (PLe: Rs 949,937/unit). The growth in realization was aided by better mix and contract manufacturing of the higher end BEVs. EBIT came in at Rs23.1bn, up by 28.3% YoY, while EBIT margin expanded by 25bps YoY to 9.2%. Excluding the contract manufacturing of the MEAL subsidiary, EBIT margin for the automotive business increased by 100bps YoY to 10%.
Volume led growth in the Farm Division: Farm Division revenue grew by 23% YoY to Rs64.3bn (PLe: Rs64.8bn) driven by tractors volume expansion of 22.9% YoY. Realization were marginally lower than expectations and came in flat at Rs 730,346/unit (PLe: Rs 736,048/unit). EBIT came in at Rs12.5bn, registering a growth of 51.5% YoY, with core tractor margin of 20.8% vis-à-vis 17.6% in Q4FY24. Multiple product intervention and strong execution in key regions delivered a market share expansion of ~230bps over FY24. Going ahead, the initial positive outlook for monsoon coupled with its focus on delivering better than industry volume of mid-single digit in FY26, augurs well for its growth prospect.
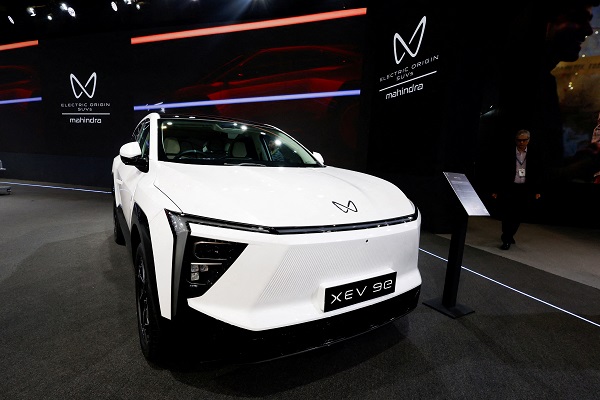
Strong execution from the EV subsidiary: MEAL, its e-SUV subsidiary delivered ~6.3k units achieving a revenue of Rs 22bn and EBITDA margin of 0.5%. Given the price point it operates and the healthy sales, the company claims to have achieved no.1 position in terms of e-SUV revenue market share of 37.2% and e-PV revenue market share of 33.1%. With strong order book and gradual capacity expansion we expect its MEAL subsidiary to be EBIT positive in the medium term (1-1.5 years of its operations).
Above views are of the author and not of the website kindly read disclaimer


