Buy Cholamandalam Investment and Finance Company Ltd for the Target Rs. 1,935 by Motilal Oswal Financial Services Ltd
Soft quarter; business volumes and asset quality to improve in 2H
Asset quality deteriorates; AUM growth at the lower end of guidance
* Cholamandalam Inv. & Finance (CIFC)’s 2QFY26 PAT grew ~20% YoY to INR11.5b (in line). PAT grew ~20% YoY in 1HFY26, and we expect its PAT to grow ~21% YoY in 2H.
* CIFC’s NII grew ~25% YoY to ~INR33.8b in 2QFY26 (in line). Other income grew ~33% YoY to ~INR7b (~5% below est.), driven by higher fee income and assignment income of ~INR764m (PQ: INR1.5b).
* CIFC’s opex rose ~23% YoY to ~INR16.2b (in line), and the cost-income ratio declined ~1pp QoQ to ~40% (PQ: 38% and PY: 41%). The sequential increase in opex was due to variable compensation/incentives and investments in building the gold and CD business. PPoP grew ~28% YoY to INR24.6b.
* Yields (calc.) rose ~5bp QoQ to ~14.45%, and CoF (calc.) declined ~15bp QoQ to ~7.65%. NIM rose ~15bp QoQ to ~6.9%. Management guided for a further ~10-15bp NIM expansion in H2FY26, aided by benefits in CoF. We expect the NIM to expand to ~7%/7.2% in FY26/FY27 (vs. ~6.9% in FY25).
* Management reiterated that the 20%+ AUM growth target remains intact, and it does not appear to be at risk. The company shared that business momentum was very healthy in Oct’25, and it expects disbursements and sequential AUM growth to accelerate in 2HFY26.
* The company also guided for overall credit costs to decline, supported by a reduction in slippages and a gradual improvement in vehicle utilization levels in 2H, which should enhance borrower repayment capacity. It is targeting to maintain credit costs at around 1.6% for the full year. We model credit costs of 1.6%/1.4% for FY26/FY27E.
* We cut our FY26E EPS by 2-3% to factor in slightly lower loan growth and higher credit costs. We model a CAGR of 14%/20%/25% in disbursement /AUM/PAT over FY25-28E. CIFC will have to utilize its levers on NIM (and fee income) to offset the impact of moderation in AUM growth and elevated credit costs. We estimate RoA/RoE of ~2.7%/20% in FY28. We reiterate our BUY rating with a TP of INR1,935 (premised on 4x Sep’27E BVPS).
* Key risks: 1) weak macros translating into weaker vehicle demand and sustained lower capacity utilization; 2) higher business volumes, following the festive season and GST cuts, rebounding to previous normalized levels, and 3) deterioration in asset quality, particularly in the new businesses and vehicle finance, which could keep the credit costs high for longer than estimated.
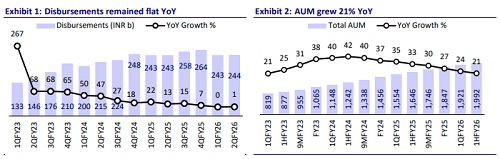
AUM rises ~21% YoY; disbursements flat both YoY and QoQ
* Business AUM grew 21% YoY/3.4% QoQ to INR1.99t, with newer businesses now forming ~12% of the AUM mix.
* Total disbursements in 2QFY26 were flat YoY and QoQ at ~INR244b. New lines of businesses contributed ~19% to the disbursement mix (PQ: ~17% and PY: ~24%), and VF disbursements in 2QFY26 grew ~10% YoY.
* Gold loan disbursements in 2QFY26 stood at ~INR5.5b and are expected to pick up in 2HFY26, which should support overall gold loan growth.
* We model a total AUM CAGR of ~20% over FY25-28E
Asset quality deteriorates across segments; GS3 up ~20bp QoQ
* GS3/NS3 deteriorated ~20bp/12bp QoQ to 3.35%/1.9%, while PCR on S3 declined ~50bp QoQ to ~43.2%. ECL/EAD rose ~7bp QoQ to 2.05% (PQ: ~1.97%). GS3 in newer businesses rose ~20bp QoQ to ~2.8% (PQ: 2.6% and PY: 1.6%).
* Stage 2 + Stage 3 (30+ dpd) rose ~25bp QoQ to ~6.45%.
* CIFC’s 2Q credit costs stood at ~INR9b (~vs. est. of INR9.2b). This translated into annualized credit costs of ~1.85% (PY: ~1.55% and PQ: ~1.9%). GNPA/NNPA (RBI IRAC) rose ~30bp/20bp QoQ to ~4.6%/3.1%. In 2QFY26, write-offs (calc.) stood at ~INR6.4b, translating into ~1.6% of TTM AUM (PY: ~1.1% and PQ: 1.3%).
* CRAR stood at ~20% (Tier 1: ~14.6%) as of Sep'25.
* Management guided credit costs of ~1.6% in FY26 (vs. ~1.4% in FY25). We estimate credit costs (as a % of avg. assets) of ~1.6%/1.4% in FY26/FY27.
Key highlights from the management commentary
* Management indicated that origination yields in gold loans remained healthy, and the company does not intend to price below industry peers to chase growth.
* Credit cost losses in the CSEL portfolio have already peaked and are expected to moderate progressively in the subsequent quarters.
* While the benefits of all the actions taken by the government (personal income tax cut, GST cuts, reduction in interest rates) were not fully visible in 2QFY26, the medium-term outlook remains strong.
Valuation and View
* CIFC delivered a soft quarter, with disbursements remaining largely flat YoY/QoQ and credit costs staying elevated. Asset quality weakened across product segments. A key positive was NIM expansion of ~15bp QoQ.
* The stock trades at 3.9x FY27E P/BV. In order to sustain this premium valuation multiple, CIFC will have to give higher confidence in its ability to deliver on its AUM growth and credit costs guidance for FY26. Further, it might have to fully leverage its diversified product suite to deliver its medium-term AUM growth guidance of 20-25%. We estimate a CAGR of ~20%/25% in AUM/PAT over FY25- 28 for an RoA/RoE of 2.7%/20% in FY28E. We reiterate our BUY rating with a TP of INR1,935 (premised on 4x Sep’27E BVPS).
For More Research Reports : Click Here
For More Motilal Oswal Securities Ltd Disclaimer
http://www.motilaloswal.com/MOSLdisclaimer/disclaimer.html
SEBI Registration number is INH000000412