Quant-Funda : Buy Bank of Maharashtra Ltd For Target Rs. 68 - Geojit Financial Services Ltd
Fundamental View
Bank of Maharashtra (BoM), established in 1935, is one of India's leading public sector banks, offering a wide range of banking and financial services. The bank plays a vital role in supporting small and medium enterprises (SMEs) and has a significant footprint in rural and semi-urban areas.
• Net interest income (NII) grew ~19%YoY in FY25 to Rs.11,666cr, led by strong growth in the loan book (advances up by ~18% YoY) and improvement in margins. Consequently, net interest margin (NIM) improved to 4.0% (up by 8bps YoY) in FY25 vs. 3.92% in FY24.
• Return on Assets (ROA) rose to 1.75% (FY25) from 1.50% in FY24, up by 25bps YoY, indicating better asset utilization.
• The RAM (Retail, Agriculture, and MSME) business saw a growth of 19.68% on a YoY basis. Retail advances increased by 25.38% YoY to Rs.64,853cr, while MSME advances grew by 14.84% YoY to Rs.48,369cr.
• PAT grew ~36%YoY to Rs.5,520cr in FY25. Net profit margin for FY25 stood at 19.4%, and operating margin at 32.8%, reflecting strong bottom-line and operational performance.
• The gross NPA ratio improved to 1.74% in FY25 from 1.88% in FY24, reflecting effective asset quality management. Net NPA declined to 0.18% from 0.20%, supported by a strong Provision Coverage Ratio of ~98.3%, indicating robust credit risk controls.
• As per market consensus, the BoM is currently trading at a P/Bv of 1.5x with a strong ROA and RoE of 1.75% and 23% as of FY25, respectively.
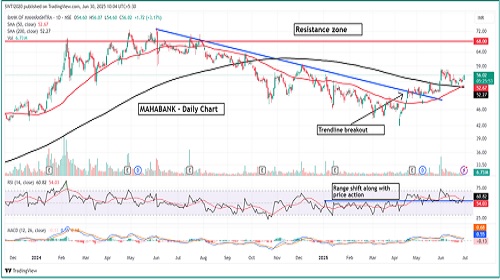
Technical View
• The stock has formed a strong base in the Rs 45–?50 zone and has since witnessed a sharp reversal.
• The stock is currently trading above all key moving averages across multiple timeframes, including a recent 'golden crossover' of the 50-DMA and 200-DMA- an indication of a strong bullish trend and potential for sustained upside.
• Momentum indicators suggest a strengthening bullish bias. The daily RSI is rising and currently around 58, indicating improving momentum.
• On the weekly chart, both RSI and MACD are trending positively, reinforcing the broader bullish outlook
For More Geojit Financial Services Ltd Disclaimer https://www.geojit.com/disclaimer
SEBI Registration Number: INH200000345