Dalmia Bharat Ltd For Target Rs. 2,620 By Choice Broking Ltd
Ignoring the noise to focus on long-term plan is impressive
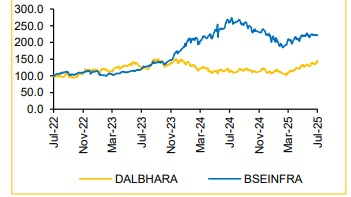
We maintain our BUY rating on Dalmia Bharat Ltd. (DALBHARA). As we fine-tune our numbers & rollover by 3 months in our valuation workings, our TP moves marginally higher to INR 2,620 (from INR 2,500 earlier). We continue to be positive on DALBHARA owing to 1) Addition of ~15 Mtpa of capacity by FY28E in new untapped regions at a reasonable capex outlay, 2) Execution on cost optimization program to cut costs by INR 150-200/t by FY28E, 3) Sector tailwinds – demand rebound and healthy pricing level across markets, and 4) As a result, expansion in RoCE by 491 bps over FY25-28E. We adopt a robust EV to CE (Enterprise Value to Capital Employed)-based valuation framework (Exhibit 3), which allows us a rational basis to assign the right valuation multiples.
We forecast DALBHARA’s EBITDA to expand at a CAGR of 27.1% over the FY25-28E basis, our volume growth assumption of 9.0%/10.0%/10.0%, and realization growth of 4.5%/2.0%/2.0% in FY26E/27E/28E, respectively. We like DALBHARA’s disciplined capital allocation & healthy balance sheet (staying below 2x to Net Debt to EBITDA) and strong focus on premium sales retains a nice upside optionality.
We value DALBHARA on the EV/CE framework – we assign an EV/CE multiple of 1.75x/1.75x for FY27E/28E, which we believe is conservative, given the doubling of ROCE, from 5.0% in FY25 to ~11.8% in FY28E under reasonable operational assumptions. We do a sanity check of our EV/CE TP using implied EV/EBITDA, P/BV, and P/E multiples. On our TP of INR 2,620, FY28E implied EV/EBITDA/PB/PE multiples are 12.6x/2.3x/29.2x.
High Quality EBITDA Beat On-street, Driven by Strong Realization. Volume a Small Drag, but can be Ignored:
DALBHARA reported Q1FY26 consolidated revenue and EBITDA of INR 36,360 Mn (+0.4% YoY, -11.1% QoQ) and INR 8,830Mn (+32.0% YoY, +11.3% QoQ) vs Choice Institutional Equities (CIE) estimates of INR 37,438Mn and INR 8,044Mn, respectively. Total volume for Q1 stood at 7.0 Mnt (vs CIE est. 7.3 Mnt), down 5.4% YoY and 18.6% QoQ, which is the only disappointing factor in the results.
Realization/t came in at INR 5,194/t (+6.2 YoY and 9.2% QoQ), which is a bit higher than CIE’s est of INR 5,152/t. Total cost/t came in at INR 3,933/t (-1.4% YoY and +2.6% QoQ). As a result, EBITDA/t came in at INR 1,261/t, which is an expansion of ~INR 339/t QoQ, which is ahead of market expectation.
Targeting INR 150–200/t Cost Reduction Despite Raw Material Inflation:
The company remains committed to achieving a cost reduction of INR 150– 200/t over the next two years. Raw material costs/t rose due to the newlyimposed mineral tax in Tamil Nadu, where over 20% of its capacity is located. For FY26E, management has guided for cost savings of INR 75/t, while we conservatively estimate ~INR 50/t, primarily driven by lower power and fuel costs from increased Waste Heat Recovery (WHRS) and renewable energy usage—RE share rose to 41% in Q1FY26 from 35% in FY25. WHRS capacity is on track to expand from 72 MW in FY25 to 89 MW in FY26E. Additionally, we expect ~INR 20/t savings in freight, supported by higher direct dispatches and shorter lead distances. Despite a likely ~INR 140/t increase in raw material costs, the company remains confident in delivering on its overall cost reduction target.
For Detailed Report With Disclaimer Visit. https://choicebroking.in/disclaimer
SEBI Registration no.: INZ 000160131


.jpg)