Buy Oil and Natural Gas Corporation Ltd For Target Rs. 295 By JM Financial Services
Earnings miss on higher opex and slightly lower sales realisation
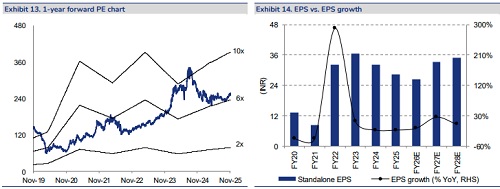
ONGC’s 2QFY26 standalone EBITDA, at INR 177bn, was 2-3% lower than JMFe/consensus of INR 183bn/INR 181bn on higher opex of INR 69.1bn vs. JMFe of INR 60bn (vs. INR 55.8bn in 1QFY26) led by forex loss of INR 11.7bn (vs. forex gain of INR 0.3bn in 1QFY26); further, crude and gas realisation was a tad lower than JMFe but crude & gas sales volume was slightly better. However, PAT, at INR 98.5bn, was significantly above JMFe/consensus of INR 88.3bn/INR 92.3bn, led by higher other income of INR 34.2bn (vs. JMFe of INR 25bn) and aided by lower dry well w/offs of INR 11bn (vs. JMFe of INR 12bn). We maintain BUY (revised TP of INR 295 – based on 6x FY28 PE vs. global peers trading at 8-10x) based on our assumption of: a) Brent at USD 70/bbl vs. CMP discounting ~USD 60/bbl of net crude realisation; and b) cumulative output growth of ~6% over FY26-28, driven by KG DW 98/2 block and Western offshore blocks. ONGC is also a robust dividend play (4-5%). At CMP, it trades at 5.7x FY28E consolidated EPS and 0.7x FY28E BV.
* ONGC’s standalone EBITDA lower than JMFe/consensus, due to higher opex and a little lower crude & gas realisation: ONGC’s 2QFY26 standalone EBITDA, at INR 177bn, was 2-3% lower than JMFe/consensus of INR 183bn/INR 181bn on higher opex at INR 69.1bn vs. JMFe of INR 60bn (vs. INR 55.8bn in 1QFY26) led by forex loss of INR 11.7bn (vs. forex gain of INR 0.3bn in 1QFY26); further, crude and gas realisation was a tad lower than JMFe but crude & gas sales volume was slightly better. However, PAT, at INR 98.5bn, was significantly above JMFe/consensus of INR 88.3bn/INR 92.3bn, led by higher other income at INR 34.2bn (vs JMFe of INR 25bn) and aided by lower dry well w/offs of INR 11bn (vs. JMFe of INR 12bn). Standalone 2QFY26 EPS is INR 7.8/share. Consolidated 2QFY26 EBITDA was higher at INR 276bn (vs. INR 277bn in 1QFY26), and consolidated PAT was also higher at INR 108bn (EPS of INR 8.6/share).
* Crude and gas sales volume slightly better than JMFe (though crude production below JMFe); crude and gas net realisation lower: In 2QFY26, domestic crude sales volume was 0.9% above JMFe at 4.8mmt (up 2.7% QoQ and up 5% YoY) though crude production volume was 1.4% below JMFe at 5.2mmt (down 0.9% QoQ but up 0.6% YoY) as sales as % of production rose to 93% (vs. ~88% historically). Computed net crude realisation was a tad lower at USD 67.2/bbl (vs. JMFe of USD 67.5/bbl). Further, gas sales volume was 0.9% above JMFe at 3.9bcm (up 0.9% QoQ and up 0.7% YoY) while overall gas realisation was marginally lower at USD 7.6/mmbtu (vs. USD 7.6/mmbtu in 1QFY26). Further, the management said gas price for production from new wells is USD 8.36/mmbtu during 2QFY26 and revenue from new well gas stood at ~INR 17bn in 2QFY26 and crossed 21% of total gas revenue from nominated fields in 1HFY26 (delivering an additional INR 3.2bn in 2QFY26 and INR 6.5bn in 1HFY26 compared to the APM gas price). Separately, OPAL’s EBITDA recovered to +INR 2.1bn in 2QFY26 (vs. negative INR 0.1bn in 1QFY26 and negative EBITDA reported since the last few quarters) with utilisation at 78% (vs. 81% in 1QFY26); however, PAT was negative INR 4.6bn in 2QFY26 (vs. negative INR 6.2bn in 1QFY26).
* OVL weak production trend continues in 2QFY26; PAT weaker QoQ at negative INR 3.5bn in 2QFY26: In 2QFY26, OVL’s crude output was down 2.2% QoQ to 1.7mmt (lower than quarterly run-rate of 2mmt in FY22 pre Ukraine invasion) while crude sales volume was at 1.3mmt. Gas output was also down 14% QoQ to 0.6bcm (much lower than quarterly run-rate of 1.1bcm in FY22) while gas sales volume was at 0.4bcm. Hence, OVL EBITDA was muted at INR 7.9bn (vs. INR 7.5bn in 1QFY26). Reported PAT was at negative INR 3.5bn in 2QFY26 (vs. negative INR
Please refer disclaimer at https://www.jmfl.com/disclaimer
SEBI Registration Number is INM000010361
