Update on Asset Quality Continues to Remain Benign in Q2FY26 by CareEdge Ratings
* The Gross Non-Performing Asset (GNPA) ratio of Scheduled Commercial Banks (SCBs) improved to 2.1% as of Q2FY26 (from 2.6% a year earlier), with GNPA declining 11.1% year-on-year (y-o-y) to Rs 4.05 lakh crore. In comparison, the Net Non-Performing Asset (NNPA) ratio remained steady at 0.5% for the third consecutive quarter (vs 0.6% in Q2FY25), with NNPAs falling 9.9% y-o-y to Rs 0.88 lakh crore. Both metrics improved due to strong recoveries and upgrades, lower incremental slippages, and portfolio clean-up through write-offs and sales to ARCs. o Sequentially, SCBs’ GNPAs and NNPAs declined by 4.2% and 5.1% q-o-q, respectively, driven by lower incremental slippages along with recoveries and upgrades, and increased NPA resolutions through ARC sales, reflecting sustained improvement in asset quality.
* SCBs’ aggregate provisioning rose marginally by 1.4% y-o-y in Q2FY26; however, the credit cost (annualised) ratio eased to 0.41% in Q2FY26 from 0.45% a year ago, reflecting stronger growth in assets compared to a rise in provisioning.
* Private sector banks (PVBs) experienced a 27.5% y-o-y increase in credit costs during Q2FY26, mainly due to extra contingency and floating provisions made by two major private banks, as well as one-time provisioning related to discontinued crop loan variants. Although the shift to an ECL-based provisioning framework is imminent and guidelines are still to be finalised, some banks have started making modest ECL-related provisions. In comparison, public sector banks (PSBs) reported a 17.7% year-on-year decline in credit costs.
* Restructured assets (across eight PSBs and PVBs) declined to 0.52% of net advances as of Q2FY26, marking a reduction of around nine basis points from the previous quarter.
Figure 1: SCBs – Gross NPAs and Net NPAs Ratio Trend (%)
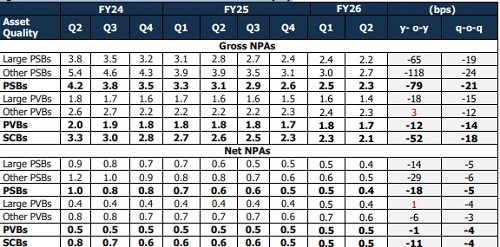
The overall stress level of SCBs was down y-o-y in Q2FY26, with declines in both GNPA and the restructured book. The GNPA stock of SCBs improved by 11.1% y-o-y to Rs 4.01 lakh crore, supported by sustained recoveries, upgradations, prudent write-offs and higher sales to ARCs during the quarter, particularly among private banks. While PVBs witnessed a marginal 2.6% y-o-y rise in GNPAs owing to higher slippages and pressure in the microfinance segment in a few private banks, the broader trend points to continued strengthening of the banking sector’s asset quality.
• GNPAs of PSBs declined by 16.3% y-o-y to Rs 2.74 lakh crore in Q2FY26. With the legacy stressed asset pool largely reduced and incremental recoveries moderated, total write-offs and recoveries declined 24.6% y-o-y to Rs 0.25 lakh crore. Fresh slippage also eased, falling 22.5% y-o-y to Rs 0.19 lakh crore, indicating an improving portfolio quality.
• GNPAs of PVBs inched up by 2.6% y-o-y to Rs 1.26 lakh crore as of Q2FY26, with slippages rising marginally to Rs 0.30 lakh crore from Rs 0.28 lakh crore in Q2FY25. The increase was primarily driven by elevated slippages in the microfinance and unsecured retail/EEB segments at select banks, particularly within the other PVBs category, where stress remained high during the quarter. However, elevated slippages reported earlier in the MFI portfolios of a few PVBs have begun to stabilise.
The NNPAs of SCBs decreased by 9.9% y-o-y to Rs 0.88 lakh crores as of Q2FY26, compared with Rs 0.97 lakh crores a year ago. NNPAs of PSBs improved by 19.1% y-o-y to Rs 0.52 lakh crore as of Q2FY26, while NNPAs of PVBs increased by 8.1% y-o-y to Rs 0.35 lakh crore, driven by stress in microfinance and unsecured segments. Sequentially, SCBs’ GNPAs declined by 4.2% in Q2FY26, driven by broad-based improvement.
PSBs reported a 4.4% q-o-q reduction in GNPAs, while PVBs saw a 3.8% decline during the quarter. This reduction was driven by lower fresh slippages, strong recoveries, and prudent write-offs. Fresh slippages across SCBs fell by 20.4% q-o-q, underscoring the sustained strengthening in asset quality, supported by resolution efforts, better credit discipline across segments and sales to ARCs
Figure 2: Sector-wise GNPA of PSBs as a % of Total Advances
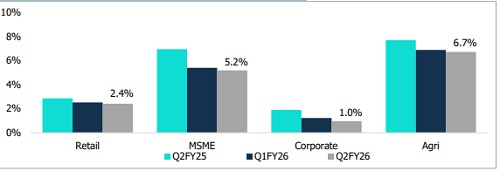
By Q2FY26, sectoral GNPAs as a percentage of total advances for PSBs continued to decline across all segments, reflecting a broad-based improvement in asset quality. This positive trend was supported by significant reductions in fresh slippages and sustained write-offs, as well as tighter underwriting norms in retail lending.
Within the retail segment, NPAs were primarily driven by stress in unsecured personal loans, education loans, and credit card receivables. The banking system’s increasing tilt toward retail lending has been fuelled by greater access to personal credit and a moderation in corporate borrowing, as large corporates deleverage and tap alternative financing avenues. In contrast, agricultural NPAs remained elevated due to structural and politically sensitive recovery challenges that continue to constrain asset quality in the segment.
Figure 3: SCBs Sustain Record-Low NNPA Levels for Three Straight Quarters in Q2FY26 (%)
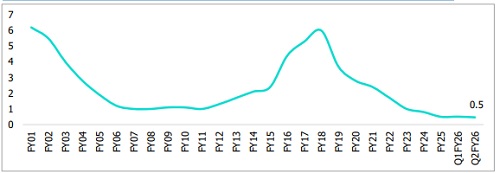
As of March 31, 2018, the NNPA ratio stood at 6%, but has since declined sharply to 0.5% as of Q2FY26, the lowest level in the post-AQR period and stable for the past three consecutive quarters. This sustained improvement reflects the combined impact of large-scale write-offs, steady recoveries from legacy NPAs, stronger provisioning buffers, sales to ARCs and timely resolutions under the IBC framework. While overall asset quality remains robust, the pace of fresh recoveries has stabilised in recent quarters, as the stock of legacy stressed assets continues to shrink.
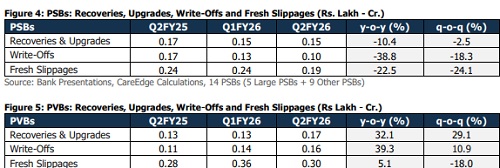
The slippage ratio of PSBs has remained below that of PVBs, supported by a combination of structural and cyclical factors. Lending growth has been concentrated in lower-risk retail segments, particularly mortgages, while the expansion in unsecured retail credit has been cautious. Furthermore, the clean-up of legacy stressed assets has advanced, thereby reducing the pool of vulnerable exposures and strengthening overall portfolio quality. Additionally, in Q2FY26, PVBs reported a 32.1% y-o-y increase in recoveries, driven partly by one-off items from a large PVB, along with a 39.3% y-o-y rise from technically written-off accounts. Excluding the impact of the one-off item, recoveries would have grown by 11.7%.
Above views are of the author and not of the website kindly read disclaimer