Buy Mahindra & Mahindra Ltd For Target Rs.3,675 by Motilal Oswal Financial Services Ltd

Operationally in line; healthy margin expansion
Auto and FES well-positioned to outperform in the coming quarters
* MM reported an in-line operating performance in 3QFY25. EBITDA margin expanded 160bp YoY to 14.6% (est. 14.2%) led by improved mix. The Farm Equipment Segment’s (FES) core PBIT margin stood at an impressive 18.1% (+260bp YoY), while the auto segment’s margin expanded 120bp YoY to 9.7%.
* We believe MM is well placed to outperform across its core businesses, driven by a healthy recovery in rural and new product launches in both UVs and tractors. We largely maintain our FY26E/27E EPS. Reiterate BUY with a TP of INR3,675 (based on Dec’26E SOTP).
Margins expand YoY for Auto and Farm Equipment divisions
* 3QFY25 revenue/EBITDA/adj. PAT grew 20%/36%/19% YoY to INR305.4b/INR44.7b/INR29.6b (est. INR312.3b/INR44.5b/INR31.9b). 9MFY25 revenue/EBITDA/PAT grew 15%/28%/18% YoY.
* Volumes expanded 18% YoY, where tractors grew ~20% YoY while UV grew 17%. 3W volumes grew 11% YoY. Realizations grew ~2% YoY to INR888.6k per vehicle (est. 908.8k).
* Revenue for Automotive and FES grew ~20%/21% YoY to INR224.1b/81.7b, respectively.
* Gross margin expanded 70bp YoY/(-20bp QoQ) to 25.4% (est. 25.8%), led by improved mix. EBITDA grew 36% YoY to INR44.7b (est. 44.5b). Consequently, EBITDA margin expanded 160bp YoY/30bp QoQ to 14.6% (est. 14.2%).
* PBIT margin - Auto: 9.7% (+120bp YoY/20bp QoQ, est. 9%); Farm: 18.1% (+260bp YoY, 60bp QoQ, est. 18.5%). Excluding the Powerol and Farm Machinery segments, core tractor margin expanded 190bp YoY to 19.5%
* Higher depreciation and tax led to an adj. PAT miss at INR29.6b (+19% YoY, est. 32b).
Highlights from the management commentary
* FES: Given strong rural sentiments led by favorable indicators, management expects the tractor industry to grow by 15%+ in Q4. This is likely to result in a 10% growth of the tractor industry for FY25E. While management has refrained from providing guidance for FY26, it expects the industry to post growth in FY26E as well.
* M&M has gained 240bp market share in Q3, reaching its highest-ever level at 44.2%. Even on a YTD basis, it has gained 170bp share, reaching 43.9%.
* Automotive: Its market share in the <3.5T pick-up segment improved 230bp YoY to 51.9%. Management is hopeful of a demand recovery in the pick-up segment in the coming quarters, despite the current slowdown.
* The capacity for the Thar Roxx stands at 9k units per month and is now fully fungible between the 3-door and 5-door variants. The company plans to increase the capacity of this model by 2k units in a couple of months. Prior discounts on the 3-door Thar variant have now been withdrawn.
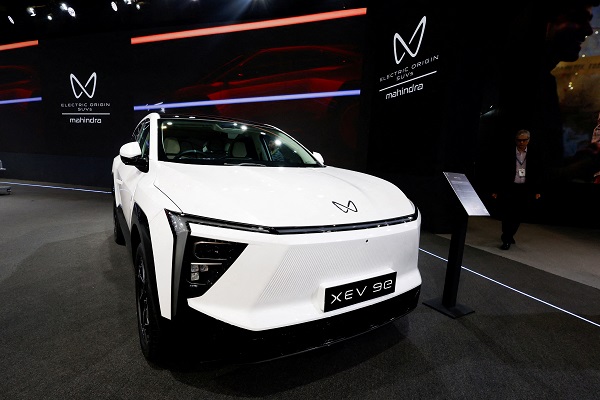
* EVs: M&M will commence bookings of the BE 6E and XE 9E from 14th Feb onwards. Given the encouraging initial response, management expects to sell 5k units per month in the initial months of launch. With the new EVs, it is attracting a fairly new customer profile, largely in the INR25-30 lakh price range, many of whom would not have considered purchasing an M&M vehicle earlier.
Valuation and view
* We largely maintain our FY26E/27E EPS. We estimate MM to post a CAGR of ~15%/19%/18% in revenue/EBITDA/PAT over FY24-27E. While MM has outperformed its own targets of earnings growth and RoE of 18% in FY24, it remains committed to delivering 15-20% EPS growth and 18% ROE, ensuring sustained profitability and shareholder value.
* The implied core P/E for MM stands at 26x/22x FY26E/FY27E EPS. Reiterate BUY with a revised TP of INR3,675 (based on Dec’26E SOTP).


For More Research Reports : Click Here
For More Motilal Oswal Securities Ltd Disclaimer
http://www.motilaloswal.com/MOSLdisclaimer/disclaimer.html
SEBI Registration number is INH000000412


