Buy HDFC Asset Management Company Ltd for the Target Rs. 6,175 By Prabhudas Liladhar Capital Ltd
Earnings quality remains strong
Quick Pointers:
* Strong quarter led by higher blended yields.
* Net flows remain strong driving stock market share gains.
HDFCAMC saw a strong quarter yet again as revenue was 1.9% more than PLe as revenue yield was better at 46.6bps (PLe 45.7bps) since (1) equity share improved QoQ to 61.0% from 60.3% due to strong MTM gains in Q1FY26 and revival in industry flows after May’25 (2) 137bps QoQ fall in share of liquid and (3) commission rationalization in Q2FY25. Due to strong equity performance in 1-yr/3-yr buckets, market share in net equity flows remains healthy at 14.3% in H1FY26 (12.9% in FY25). Hence stock equity market share increased by 3bps QoQ to 12.83%. MF industry is seeing healthy equity flows; net flows rose QoQ from Rs779bn to Rs1,259bn in Q2FY25. Due to strong pedigree and superior performance HDFCAMC could benefit from increased industry flows. We maintain core EPS for FY27/28E but slightly increase multiple to 41x from 40x and raise TP to Rs6,175 from Rs6,000. Retain ‘BUY’.
* Good quarter led by beat on revenue yields: QAAuM was in-line at Rs8814bn (+6.4% QoQ); while equity (incl. bal) at Rs5378bn grew by 7.6% QoQ. Revenue was better at Rs10.26bn (PLe Rs 10.07bn) led by higher yield at 46.6bps (PLe 45.7bps). Opex was more at Rs2.5bn (PLe Rs2.3bn) due to higher staff cost and other exp. Employee cost was higher at Rs1235mn (PLe Rs1053mn); ESOP cost was Rs211mn. Other expenses soared to Rs1229mn (PLe Rs1071mn). Hence, core income was stable at Rs7.8bn (PLe Rs7.7bn) resulting in operating yields at 35.4bps (vs PLe 35.2bps). Other income was slightly ahead at Rs1bn (PLe Rs0.8bn). Tax rate fell to 18% (PLe 25%) owing to reversal of previous years’ provisions to the tune of Rs468mn. Hence, core PAT yields adjusted for tax reversal were in-line at 26bps. PAT was 12.7% ahead of PLe at Rs7.2bn. Management announced bonus at 1:1 with record date fixed at 26th Nov’25.
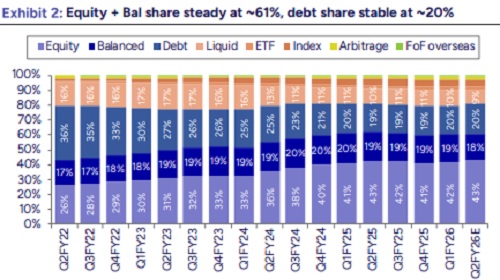
* Impact of rationalization and equity mix supporting yields: Equity share (incl. bal) increased to 61.0% (60.3% in Q1FY26); debt share also slightly inched up QoQ to 20.2% while liquid share fall by 137bps to 8.9%. Despite equity QAAuM growth of 7.6% QoQ, yield was maintained at 46.6bps QoQ due to (1) increase in share of equity/debt and decline in liquid and (2) impact of commission rationalization (done in Q2FY25). Equity performance that was deteriorating in 1-yr bucket has been improving since May’25 while it remains superior in the 3-yr bucket. This is driving market share in net flows to be higher than equity AuM. Hence, market share in equity QAAuM improved by 3bps QoQ to 12.8%. Blended yields were stable QoQ: overall at 46bps, equity at 58bps, debt at 27- 28bps, liquid at 12-13bps. Unique investor market share for HDFCAMC improved by 66bps QoQ to 25.4%.
* Opex to normalize in upcoming quarters: The quarter saw 6% higher opex driven by (1) increase in ESOP cost QoQ to Rs211mn from Rs57mn as NRC had approved a new ESOP scheme of 2.5mn shares in Q4FY25 and (2) rise in business promotion and CSR expenses. Hence, opex should normalize in the upcoming quarter. ESOP and PSU cost will be allocated as: FY26-Rs560mn in FY27E-Rs630mn, FY28E-Rs510mn, FY29E-Rs320mn and FY30E-Rs60mn. Further, residual cost on old ESOP plan stood at Rs110mn for FY26E and Rs30mn for FY27E. Over FY25-27E, we are factoring opex CAGR of 12.2% while other opex could grow at a 12.4% CAGR.
Please refer disclaimer at https://www.plindia.com/disclaimer/
SEBI Registration No. INH000000271


.jpg)