Buy Fractal Analytics Ltd for the Target Rs. 6,000 by Choice Institutional Equities
Strong AI and Margin Momentum Reinforce Outlook
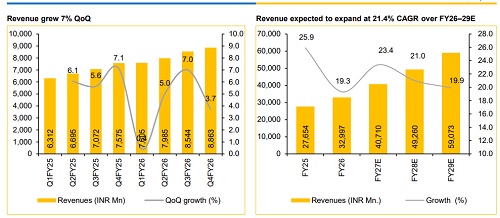
FRACTAL’s Q4FY26 performance reinforces confidence in its improving growth-quality and profitability trajectory, driven by strong traction in Healthcare, BFSI and IP-led businesses. Margin expansion remained a key highlight, supported by pricing gains, output-based engagements and improving operating leverage, indicating a structurally improving business mix. Despite temporary weakness in TMT due to client-specific issues, healthy NRR, improving revenue productivity and strong growth in platform-led businesses, such as Asper and Analytics Vidhya reflect robust client mining and increasing monetisation of AI-led offering. Continued investments in R&D alongside improving margin suggests that the company is balancing growth and innovation effectively, positioning it well to benefit from rising enterprise AI adoption and platform-led transformation opportunities. We expect Revenue/EBIT/PAT to grow at a CAGR of 21.4%/44.6%/46.5% over FY26E–FY29E. We maintain our ‘BUY’ rating deriving a DCF-based target price of INR 1,250 on an implied PE of 31x based on FY28E EPS of INR 40.4.
Margins and PAT Surprise Positively; Highlights Execution Strength
* In Q4FY26, FRACTAL posted revenue of INR 8,863 Mn, up 3.7% QoQ (vs CIE estimate of +4.7% QoQ). For the full year, revenue came in at INR 32,997 Mn, up 19% YoY.
* Gross margin stood at 48% as of Q4FY26 up by 100 bps QoQ and 47 bps YoY, whereas, for the full year FY26, it came in at 46.8%, up 93 bps YoY.
* EBIT margin came in at 16% for Q4FY26, up 500 bps QoQ (vs CIE estimate of 12.7%) and, for FY26, it stood at 11.3%, up 230 bps YoY.
* PAT for the quarter came in at INR 1,158 Mn, up 15.7% QoQ (vs CIE estimate of -26.7% QoQ), whereas, for FY26, PAT stood at INR 2,868 Mn, up 30% YoY
Strong HLS and BFSI Growth Drive Revenue Momentum
FRACTAL reported strong revenue growth of 3.7% QoQ this quarter, led by stellar performance in HLS segment (13.0%) and is now the second-largest vertical, followed by BFSI (+14.5%) and CPGR segments (6.2%) all on QoQ basis. The TMT segment declined (-13.2%) due to two client-specific issues that are expected to normalise in the coming quarters. FRACTAL further expanded its relationships with existing clients resulting in a Net Revenue Retention (NRR) of 112% in this quarter. The company clocked in a Revenue per Billable FTE of USD 85k and INR 7.5 Mn in INR terms, up by 5% YoY, reflecting improving productivity and better monetisation. Alpha businesses continued to scale up strongly, with Asper growing 31% YoY and Analytics Vidhya growing 49% YoY in Q4FY26, reinforcing traction in IP-led and platform-led offering.
Margin Expansion Accelerates on Improved Engagement Mix
Gross margin improved to 48.2% in Q4FY26 (120 bps QoQ), supported by higher contribution from output-based contracts, pricing improvements and FX tailwinds. EBIT margin expanded sharply to 16.2% (+500 bps QoQ), reflecting strong operating leverage. FY26 gross and EBIT margins stood at 46.8% and 11.3%, respectively, both improving YoY, primarily driven by a richer mix of output-based engagements and pricing gains. EBITDA margin improved despite higher SG&A investments towards scaling up key client relationships and continued R&D investments of INR 212 Cr in FY26 (INR 134 Cr expensed through P&L).
For Detailed Report With Disclaimer Visit. https://choicebroking.in/disclaimer
SEBI Registration no.: INZ 000160131