Reduce Kotak Mahindra Bank Ltd For Target Rs. 2,100 By JM Financial Services
Inline quarter; valuation fair for growth/returns profile
KMB standalone PAT declined -3%/-1% YoY/QoQ, broadly in-line with JMFe but 3% below consensus driving RoA/RoE of ~1.9%/10.5%. Loan growth was strong at ~16%/4% YoY/QoQ and deposit growth of ~15%/3% YoY/QoQ was higher than most of its peers (flat QoQ for ICICI, ~1.4%/3.6% QoQ for HDFCB/Axis). Inch up in CD ratio was lower than its large peers (~76bps QoQ for KMB vs. ~156/252/293bps QoQ for Axis/ICICI/HDFCB). NIM (calc.) compression of ~5bps QoQ was in-line with AXSB/HDFCB/ICICI (~5/7/8bps) despite lower inch up in CD ratio. CASA growth picked-up at 11%/7% YoY/QoQ after 13 quarters of muted growth (<8% YoY). Asset quality improved as gross/net slippages declined ~23/34bps QoQ, driving credit cost lower at ~84bps. Management indicated improving assets quality in unsecured retail portfolio but highlighted stress in retail/small CV segment. We have increased our FY26/27E EPS by ~3- 4% to factor in lower credit cost and opex. We expect loan CAGR of ~16% during FY25-27E with avg. RoA/RoE of ~1.9%/11% in FY26/27E. Given ~10% rally in stock price in last 1 month, KMB’s current standalone valuation of 2.0x FY27 BVPS is only ~10% discount to HDFCB/ICICIB. Hence, we downgrade the stock to REDUCE (as per our new rating system) and keep TP unchanged at INR 2,100, valuing the core bank at 1.9x FY27E BVPS.
* NIM performance was in-line with large peers but not so impressive:
KMB’s NIM (calc.) declined 5bps QoQ which was almost similar to its peers AXSB/HDFCB/ICICI (5bps/7bps/8bps). The bank has reported higher loan and deposit growth better than peers (i.e. HDFCB/ICICIB/AXSB) at 16%YoY (vs. WAVG of ~10% YoY) and 15%YoY (vs. WAVG of ~10% YoY). Further, KMB’s CD ratio has expanded by just 75bps QoQ vs. >150bps for HDFCB/ICICIB/AXSB. Management guided for an improving margin from coming quarters.
* Sustained growth driven by low-yielding book:
KMB’s CASA ratio inched up to 42.3%, indicating a healthy contribution from low-cost deposits. We expect this to get factored in next quarter cost of funds. Loan growth momentum was driven by working capital loans (grew 8% QoQ) (i.e. secured business banking), low-yield mortgage loans (grew 5% QoQ), corporate loans (grew 6% QoQ) and SME loans (grew 7% QoQ).
* Improvement in asset quality:
KMB’s asset quality improved, with gross/net slippages declining ~23bps/34bps QoQ to 1.47%/0.85%. Write-offs (17% of GNPA) were offset by steady recoveries/upgrades (~11% of GNPA). This has resulted in lower credit cost (calc.) ~0.84%, reflecting an improvement of 27bps QoQ. Management highlighted that credit cost in unsecured portfolio is moderating and will stabilise in coming quarters. However, the management also indicated pain in small/retail CV segment which will take few quarters to stabilize.
* Largely In-line quarterly performance:
Core operating profit grew 8% YoY, driven by higher fee income (4%/7% YoY/QoQ) and 3% QoQ decline in opex. However, negative treasury income impacted PAT, as a result PAT declined 3%/1% YoY/QoQ (~1% lower than JMFe). Opex growth continues to remain muted over past two quarter was result of cost control efforts, tech/digital initiatives and lower employee retiral benefit cost.
* Valuations and view:
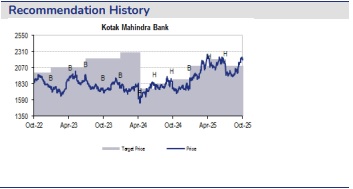
We have increased our FY26/27E EPS by ~3-4% to factor in lower credit cost and opex. We expect loan CAGR of ~16% during FY25-27E with avg. RoA/RoE of ~1.9%/11% in FY26/27E. Given ~10% rally in stock in last 1 month, KMB’s current standalone valuation of 2.0x FY27 BVPS is ~10% discount to HDFCB/ICICIB. We downgrade the stock to REDUCE and keep TP unchanged at INR 2,100, valuing the core bank at 1.9x FY27E BVPS.
Please refer disclaimer at https://www.jmfl.com/disclaimer
SEBI Registration Number is INM000010361


