Neutral Bajaj Finserv Ltd for the Target Rs. 2000 by Motilal Oswal Financial Services Ltd
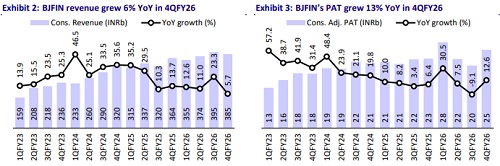
* Bajaj Finserv (BJFIN) reported consolidated revenue of INR385.1b (+6% YoY) and PAT of INR25.4b (+13% YoY) in 4QFY26. For FY26, revenue grew 13% YoY to INR1.5t and PAT rose 10% YoY to INR98b.
* Bajaj General (BGen) reported flat GWP at INR43.2b (9% miss). For FY26, GWP grew 8% YoY to INR233.3b. PAT at INR3.7b grew 2% YoY (26% miss). For FY26, PAT grew 6% YoY to INR19.5b.
* Bajaj Life (BLife) reported 17% YoY growth in APE to INR29b (5% beat). For FY26, APE grew 7% YoY to INR84.9b. VNB witnessed strong growth of 29% YoY to INR7.1b (13% beat), resulting in VNB margin of 24.5% (+240bp YoY). For FY26, VNB grew 41% YoY to INR16.3b with VNB margin of 19.2%.
* Management expects the AMC business to achieve breakeven at AUM of INR1t with potential launch of PMS/SIF offerings in 1-1.5 years. Bajaj Finserv Markets’ revenue is expected to recover in FY27 with the platform migration complete.
* In BGen, we have maintained NEP estimates but cut our PAT estimates by 9%/7% in FY27/FY28 considering 4QFY26 performance. In BLife, we have increased our VNB margin estimates by 50bp/100bp for FY27/28. On a consolidated basis, we have increased BJFIN’s EPS estimates by 1%/5% for FY27/28. Reiterate Neutral with a TP of INR2,000 (based on SoTP).
Bajaj General – Competitive pressure in motor
* Flat YoY GWP performance in 4Q was owing to a 75% YoY decline in crop GWP. Motor segment witnessed 5% YoY growth amid high competitive pressure. Retail health/group health maintained double-digit growth trajectory, with GWP growing 12%/17% YoY.
* Motor continued to contribute the highest to the GWP mix at 43% in 4QFY26 (41% in 4QFY25), followed by the commercial segment at 16% (17% in 4QFY25). Health (retail+group+govt.) contributed 25% to the mix compared to 20% in 4QFY25.
* Brokers remained the largest contributor to GWP (43% in 4QFY26 from 49% in 4QFY25), followed by individual agents (21% from 19% in 4QFY25). Banca channel contributed 13% (10% in 4QFY25), aided by new partnerships.
* Claim ratio increased YoY to 68.1% (vs. 62.1% in 4QFY25) but was better than our estimate (72.3%). The rise in claims ratio was largely driven by an increase in motor OD claims ratio to 69.2% (63.1% in 4QFY25) and health claims ratio to 85.9% (73% in 4QFY25).
* Combined ratio at 113.6% increased 880bp YoY (vs. our est. of 100.1%) due to retrospective accounting of a reinsurance treaty in government health business. For FY26, combined ratio increased 50bp YoY to 102.8%.
Bajaj Life – Margin expansion led by product mix shift
* BLife’s APE growth of 17% YoY in 4QFY26 was on the back of 10% YoY growth in individual APE and 118% YoY growth in group APE.
* Within individual APE, annuity (12% of APE) was the fastest-growing segment with APE more than doubling YoY. Protection (8% of APE) witnessed 46% YoY growth, followed by 31% YoY growth in par (25% of APE) and 18% YoY growth in ULIP (43% of APE). Non-par savings (12% of APE) declined 51% YoY.
* Improving product-level profitability and the rising share of annuity and protection offset the impact of GST and led to VNB margin expansion from 14.5% in FY25 to 19.2% in FY26.
* As of FY26 end, EV stood at INR253b, reflecting operating RoEV of 14.1%.
* Channel mix remained largely stable, with agency/banca/direct channels contributing 30%/57%/13%.
Emerging subsidiaries
* Bajaj Finserv Direct (BFD) reported revenue of INR1b (-31% YoY), maintaining sequential growth trajectory after the completion of platform migration. Loss was INR360m compared to INR170m in 4QFY25.
* Bajaj Finserv Health (BFH) reported revenue of INR3.1b (+41% YoY) with 6.5m+ transactions completed on the platform. Loss was at INR360m compared to INR460m in 4QFY25.
* Bajaj Finserv AMC (BFAMC) reported revenue of INR190m and loss of INR400m, with AUM at INR268.2b at the end of FY26.
Key highlights from the management commentary
* Profitability was impacted by adverse MTM movements due to weak market conditions during the quarter. On a normalized basis, consolidated revenue would have grown by ~14% and consolidated PAT by ~24%.
* Management’s target product mix for BLife is ~25% par, ~25-30% annuity + non-par, ~10% term, and ~40% ULIP.
* BGen’s PAT growth was flat, impacted by timing variances in government health schemes and lower contribution from crop insurance (which was highly profitable last year).
Valuation and view
* BJFIN is entering a phase where growth is increasingly broad-based, with BAF providing earnings stability, insurance businesses transitioning into margin-led, value-accretive growth, and new digital platforms moving closer to scale and breakeven. Improved execution across life and general insurance, alongside disciplined capital allocation in emerging subsidiaries, enhances visibility on consolidated value creation over the medium term. Given the diversified earnings profile, a strong balance sheet and improving contributions from non-lending businesses, BJFIN merits a premium holding-company valuation.
* Considering 4QFY26 performance, in BGen, we have maintained NEP estimates but cut our PAT estimates by 9%/7% in FY27/28. In BLife, we have increased our VNB margin estimates by 50bp/100bp for FY27/28. On a consolidated basis, we have increased BJFIN’s EPS estimates by 1%/5% for FY27/28. Reiterate Neutral with a TP of INR2,000 (based on SoTP).
For More Motilal Oswal Securities Ltd Disclaimer
http://www.motilaloswal.com/MOSLdisclaimer/disclaimer.html
SEBI Registration number is INH00000041