MFs O/s Debt Exposure to NBFCs at an 82-Month High by CareEdge Ratings

Synopsis
* Mutual Fund (MF) debt exposure to Non-Banking Financial Companies (NBFCs), which includes Commercial Papers (CPs) and Corporate Debt, has remained over the Rs 2 lakh crore mark for 13 consecutive months, hitting an 82-month high. In April 2025, this exposure reached Rs 2.69 lakh crore, reflecting a y-o-y increase of 29.4% and a sequential rise of 9.1%.
* Additionally, CPs have consistently been over the one lakh crore mark for the past 17 months, currently totalling Rs 1.41 lakh crore. Banks' credit exposure to NBFCs stood at Rs 16.1 lakh crore in April 2025, indicating a 2.9% y-o-y growth. On a month-on-month (m-o-m) basis, the amount fell by 1.6%. However, the proportion of NBFC exposure relative to aggregate credit decreased from 9.5% in April 2024 to 8.9% in April 2025.
* In April 2025, mutual funds' debt exposure to NBFCs increased in size to 16.7% of "Banks' advances to NBFCs" sequentially from 15.1% in March 2025 and y-o-y from 13.3% in April 2024.
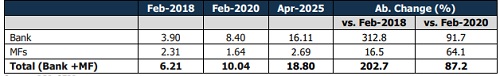
Figure 1: Summary of Banks Loans and MFs NBFC Debt Exposure (Rs. lakh crore)
The data in Figure 1 does not account for the liquidity provided to NBFCs by banks via the securitisation route (direct assignment & pass-through certificates) as well as the Treasury investments made by banks in the NBFCs’ capital market issuances.
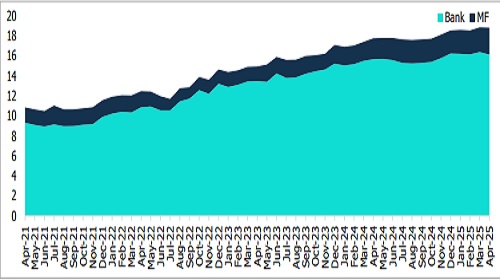
Figure 2: NBFC Debt Sources (Rs lakh crore) – Aggregate Exposure has Tripled
Since February 2018, bank lending to NBFCs has surged over 4.1 times, while Mutual Fund (MF) exposure has increased by 1.1 times. The MF debt exposure to NBFCs has remained over Rs 2 lakh crore for 13 consecutive months. In April 2025, this exposure reached Rs 2.69 lakh crore, reflecting a y-o-y increase of 29.4% and a sequential rise of 9.1%. The surge has resulted in the o/s NBFC debt exposure touching an 82-month high, finally surpassing the July 2018 levels. The Commercial Paper (CP) outstanding remains above Rs 1 lakh crore at Rs 1.41 lakh crore. However, despite this increase, MF exposure to NBFCs has reduced from nearly 20% in late 2018 to around 16.7% by April 2025. In contrast, the share of bank advances to NBFCs has almost doubled from 4.5% in February 2018 to 8.9% in April 2025, though it decreased from 9.5% in April 2024.
Figure 3: Growth in Bank Credit to NBFCs vis-à-vis overall Bank Credit Growth
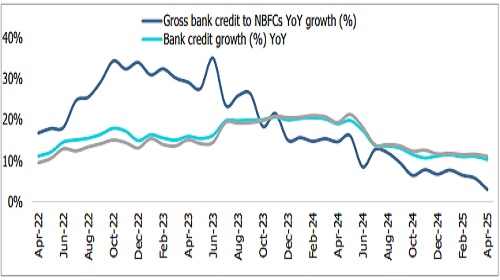
In April 2025, banks’ outstanding credit exposure to NBFCs was Rs 16.1 lakh crore, reflecting a year-on-year growth of 2.9%, a sharp drop from the prior year. Meanwhile, advances fell by 1.6% month-on-month. Since December 2023, advances to NBFCs have lagged the overall bank credit growth due to regulatory changes, base effects, and rising capital market borrowings. The share of NBFC credit in total bank credit decreased from 9.5% in April 2024 to 8.9% in April 2025.
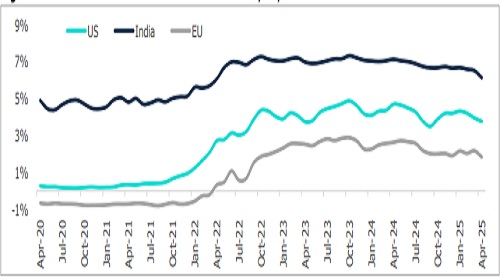
Figure 5: Movement in Three-Year G Sec Yield: India, US, and EU
According to the RBI, fund mobilisation through issuances of Certificate of Deposits grew around 5% y-o-y to Rs 0.48 lakh crore during FY26 (up to May 2, 2025) amidst a persisting but narrowing wedge between credit and deposit growth. Similarly, CP issuances at Rs 1.18 lakh crore were higher by 59% y-o-y during FY26 (up to May 15) compared with the previous year's corresponding period. Meanwhile, during the April 16 to May 19, 2025 period, the weighted average discount rate (WADR) of CPs and weighted average effective interest rate (WAEIR) of CDs remained lower by 77 bps and 73 bps, respectively, than their levels recorded a year ago.
Figure 6: Total Debt Funds Deployed in NBFCs via CPs and Corporate Debt (Rs lakh crore)
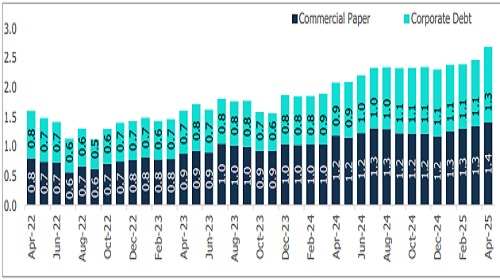
Investment in corporate debt of NBFCs grew by 42.8% year-on-year and 13.8% month-on-month, reaching Rs 1.28 lakh crore in March 2025. The share of corporate debt from NBFCs increased to 5.2% from 4.4% the previous year. Outstanding investments in CPs of NBFCs exceeded Rs one lakh crore for the 17th consecutive month, rising by 19.2% year-on-year and 5.2% month-on-month to Rs 1.41 lakh crore. CPs (less than 90 days) rose 2.8% yearon-year to Rs 0.81 lakh crore, while CPs (90 to 182 days) nearly tripled to Rs 0.14 lakh crore, and CPs (more than 6 months) rose by 35.9% to Rs 0.46 lakh crore. However, the share of CPs (less than 90 days) reduced to 57.1% from 66.2%.
Figure 7: Total Debt Funds Deployed in NBFCs via CPs and Corporate Debt (%)
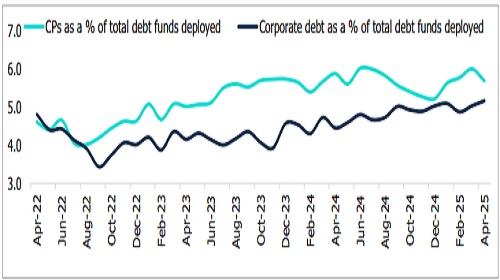
The percentage share of funds deployed by MFs in CPs as a percentage of banks’ exposure to the NBFCs rose to 8.8% in April 2025 from 7.6% in April 2024. The proportion of CPs (less than 90 days) deployed in NBFCs as a percentage of aggregate funds deployed for less than 90 days reduced to 7.9% in April 2025 as compared to 9.5% over a year ago period, the percentage of CPs (greater than six months) too reduced to 10.7% from 12.1% over a year ago, and CPs (90 days to 182 days) percentage rose to 13.9% in April 2025 as compared to 8.2% over a year-ago period.
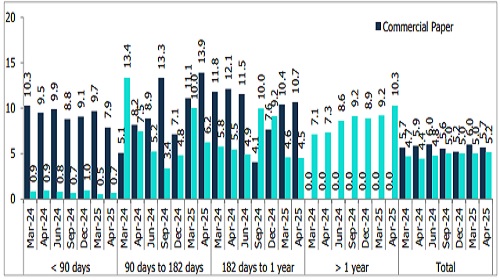
Figure 8: Trend in Proportion of CPs & CD Deployed in NBFCs as a % of Debt Funds by Duration
Conclusion
Following the RBI's restoration of earlier risk weights on bank loans to NBFCs effective April 2025, growth in bank exposure to NBFCs has tapered significantly. Meanwhile, mutual fund exposure to NBFC debt instruments has continued to exceed Rs 2 lakh crore over the last 13 months, reaching Rs 2.69 lakh crore by April 2025. NBFCs are diversifying their liability profiles, with long-term funds from banks still preferred. However, their share has declined in favour of long-term debt instruments, mainly held by insurance companies and mutual funds.
Above views are of the author and not of the website kindly read disclaimer


.jpg )