Hold Shriram Finance Ltd For Target Rs.650 by Prabhudas Liladhar Capital Ltd

Expect NIM to improve; asset quality monitorable
Quick Pointers:
* NIM declined 14 bps QoQ to 8.11% on account of excess liquidity; expect it to improve aided by lower CoF in subsequent quarters
* Stage 2 % increased to 7.3%; we remain wary of stress and build a higher credit cost
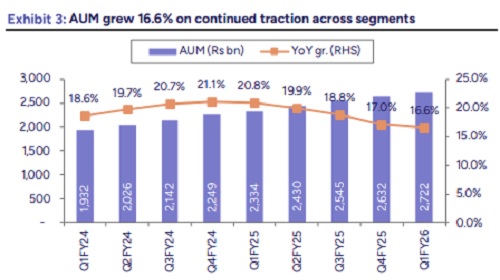
Q1FY26 AUM grew 16.6% YoY to Rs 2,722.5 bn, led by strong growth in the PV, 2W, MSME and Farm Equipment portfolio. NII saw a lukewarm growth of 10% YoY impacted by negative carry from excess liquidity; however CoF has started to reduce and we expect NIM to improve in FY26. While credit cost was controlled (at 2.1%), Stage 2 increased by 40 bps QoQ. We remain conservative and build a higher credit cost of 2.1% for FY26E (vs. guidance of <2%). We marginally tweak our FY26/ FY27 estimates and expect SHFL to deliver RoA/ RoE of 3.3%/ 17.0% in FY27E, led by steady growth in AUM, favourable margin profile and controlled asset quality ratios. We slightly cut our multiple to 1.8x on Mar’27 ABV (vs. 1.9x earlier) with a TP of Rs 650. Maintain HOLD.
* Expect steady AUM growth in FY26: 1QFY26 disbursements registered a growth of 13% YoY to Rs 418.2 bn. Consequently, AUM growth was robust at 16.6% YoY/ 3.4% QoQ to Rs 2,722.5 bn, led by the PV/ MSME/ Farm Equipment segment (+23.2%/ 34.8%/ 46.3% YoY respectively). The split among CV/PV/CE/Farm Equipment/ MSME/2W/ Gold/Personal Loans stood at 45.2%/ 20.8%/ 6.1%/ 2.1%/ 14.3%/ 5.8%/ 1.9%/ 3.8% respectively. CV sales saw tepid growth in the quarter (12% YoY) and commentary highlighted a disruption in demand due to seasonality/ excess rains. It expects a pick-up in the LCV segment in H2 on strong rural consumption and is confident of meeting a run-rate of 15%+ AUM growth in FY26E; we build ~16%.
* Excess liquidity is a drag; expect NIM to improve: NII grew 10.3% YoY (3.7% QoQ) to Rs 57.7 bn. However, reported NIM saw a contraction of 14 bps QoQ to 8.11% due to negative carry from excess liquidity (~equivalent to 5M of liabilities). Company expects it to normalize over the next 4-5 months and will be returning to its usual policy of maintaining liquidity equivalent to 3M of liabilities. Commentary also highlighted a reduction in incremental cost of borrowing in the quarter (8.37% vs. 8.86% in Q4FY25) and expects it to come down further in FY26. Factoring a normalizing trend in liquidity and a reduction in CoF, we expect NIM to improve in FY26E. Cost/Income ratio stood at 29.3% vs. 27.6% in Q4; we expect opex to be elevated (~30%) over the near-term as the company invests in the franchise.
* Asset quality trend monitorable: Headline asset quality ratio remained largely stable at GS3/NS3 at 4.53%/ 2.57% vs. 4.55%/ 2.64% in Q4FY25. Stage 2 however, increased to 7.3% vs. 6.9% in Q4FY25, led by a 15-61 bps sequential increase in the PV, CE, CV, Gold and 2W portfolio. Commentary attributed it to uneven rains/ slowdown in the economy, but highlighted that cash flows remain strong. On the MSME side, company is focusing on small- ticket loans to the trading and services sector (whole-sellers, shopkeepers etc.) which is seeing steady demand. Stage 3 PCR stood at 44.3% (vs. 43.3% in Q4FY25) and company expects to maintain it at ~40% (similar to pre-Covid levels). It has guided for a credit cost of <2% for FY26 (vs. 2.1% for Q1FY26); we remain wary and build a higher rate of 2.1% in FY26E.
Above views are of the author and not of the website kindly read disclaimer