Buy Vinati Organics Ltd for the Target Rs. 2,091 By Prabhudas Liladhar Capital Ltd

Lower Input Costs Fuel Margin Expansion
Quick Pointers:
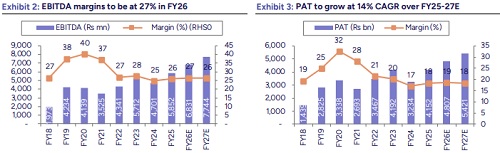
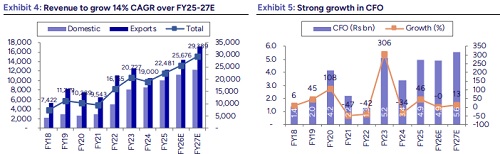
* 15% revenue growth guidance for FY26, margin guidance of 27% for FY26
* Phase 1 of ATBS capacity expansion completed in Aug’25, second phase to come online in April’26.
Due to the recent correction in stock performance along with strong visibility from ATBS, new product ramp-up, and capacity expansion, we upgraded Vinati Organics (VO IN) to ‘BUY’ with a target price of Rs2,091, valuing the stock at 40x FY27 EPS. The company reported revenue of Rs5.4bn in Q1FY26, reflecting a modest 3.3% YoY increase but a sharp 16% sequential decline. Management has guided for ~15% revenue growth in FY26, led by an expected 20% increase in volumes, with EBITDA margins projected at ~27%. ATBS, the company’s flagship high-margin product, continued to deliver robust growth and remains oversold, likely to be supported by rising demand from the oil & gas sector where it is used as a tertiary oil recovery agent. Phase I of the ATBS capacity expansion has been completed, while Phase II is scheduled to come online in April’26. In the Antioxidants (AOs) segment, demand remains healthy though pricing pressure persists due to competition from China and Singapore. New products such as MEHQ and Guaiacol did not contribute meaningfully in Q1, but are expected to ramp up in FY26, with a combined peak revenue potential of ~Rs4bn. Additionally, upcoming product launches including anisole, 4MAP, TAA, and PTAP, expected in Q2FY26 and Q3FY26 are likely to strengthen the growth trajectory. We upgraded the stock to ‘BUY’. The stock is currently trading at 32x FY27 EPS.
* Revenue increased by 3.3% YoY: Standalone and Consolidated revenue stood at Rs5.4bn (3.3% YoY/ -16.4% QoQ) (PLe: Rs5.9bn, Consensus: Rs5.7bn), the actual topline was 9% lower than our estimates. Gross profit margin was 52% (vs 44.9% in Q1FY25 and 47.4% in Q4FY25), increased sequentially as well as YoY due to lower overall raw material cost. Margins expanded by 710bps YoY and 460bps QoQ due to sharp decline in key raw material costs.
* EBITDAM expanded to 30.6% in Q1FY26: EBITDA stood at Rs1.7bn, increased 32.6% YoY, but declined 9.7% QoQ (PLe: Rs1,6bn, Consensus: Rs1.5bn). EBITDAM stood at 30.6% (PLe: 27.6%) as against a margin of 23.8% in Q1FY25 and of 28.3% in Q4FY25. Margins expanded by 680bps YoY and 230bps QoQ due to lower overhead costs. Reported standalone PAT was at Rs1,128mn (31.2% YoY/- 11.6% QoQ), while margins were at 20.8% vs 16.4% in Q1FY25 and 19.7% Q4FY25 respectively.
* Management commentary: (1) The company derives ~33% of its revenue from the USA, with nearly 80% of exports comprising ATBS and related products that are exempt from tariffs. (2) Products such as butyl phenol and AOs, which fall under US tariffs, contribute only ~2–3% of total revenue, thereby limiting the overall impact. (3) Declining raw material prices have supported margin expansion during the period, sustainable EBITDAM to be 27%. (4) For FY26, management has guided ~15% revenue growth, driven primarily by an expected 20% increase in volumes. (5) In the AO segment, China and Singapore remain the key competitors. (6) Phase I of the ATBS capacity expansion is completed this month, while Phase II is expected to come online in April’26.
Above views are of the author and not of the website kindly read disclaimer