Add Mahindra & Mahindra Ltd for the Target Rs.3,800 By Emkay Global Financial Services Ltd
Vision FY30 – To sustain SUV leadership and expand globally
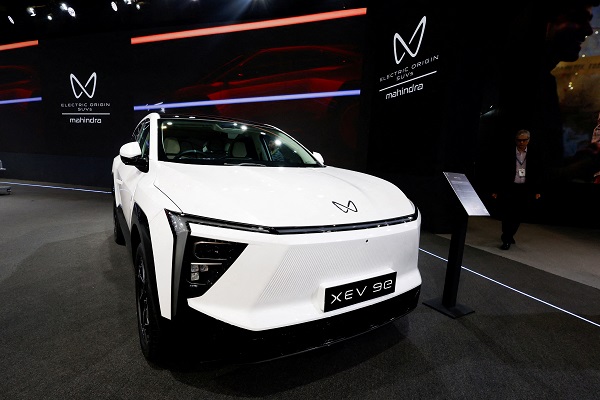
We attended M&M’s analyst meet, where the company gave guidance for implied 15-17% FY25-30 revenue CAGR for its India Auto and Farm business. The management reiterated sustained SUV leadership (H1FY26 market share: 26.4%) and guided for 20% FY25-30 consolidated Auto revenue CAGR, which implies i) 15-17% CAGR for the domestic SUV business, 10% implied volume CAGR for the LCV business, and 30% revenue CAGR for LMM. EVs are central to M&M’s roadmap (20-30% volume mix by FY30 vs 8% now; multiple launches in next 2-3Y), with clear path to profitability via localization/scale-up. LCVs have emerged as a key near-term catalyst, with the GST-led TCO reset to trigger a replacement-led cycle. M&M’s Farm business is benefitting from tailwinds, such as the improving horticulture/cash crop profitability and higher HP migration; this is leading to upgrade in FY25-30 industry volume CAGR guidance to 9% (7% earlier), with M&M aiming for 3x growth in FY20-30 consolidated Farm revenue (implying 5% FY25-30 CAGR). FY26-28E EPS is unchanged. Limited ICE-SUV launch visibility over the next 12-15M and high base catch-up limit the upside, in our view. Hence, we retain ADD on M&M, rolling forward to Dec-26E, with TP raised by 4.1% to Rs3,800 (from Rs3,650)
Key Takeaways
1) Autos: i) Auto consol business CAGR guidance stands at 20% over FY25-30, on a) premiumization of the SUV portfolio, b) EV scale-up with higher ASPs, c) ramp up in LCVs, and d) volume growth combined with mix enrichment; M&M targets 8x SUV revenue scale-up over FY20-30 (implies 20% FY25-30 CAGR), anchored by the NU_IQ and INGLO platforms and flexible powertrains. The mgmt reiterated that SUVs now form ~65% of the entire PV industry, and this mix is rising; ii) Also, 80% of the recent M&M customers are first-time Mahindra buyers. 2) SUVs: early post-GST data suggests strong momentum with Oct-25 SUV/small car industry growth at 19%/13% with revival in diesel SUV demand. On exports, M&M expects 3.5-4k units/month run-rate led by Scorpio-N and 3XO. 3) LCVs: remain the biggest near-term upside, as the GST-led ~10% price correction offsets 5Y of commodity-driven 25-30% cost inflation, resetting TCO and unlocking a replacement-led multi-year recovery. 4) MEAL (EVs): M&M expects EVs to reach ~20-30% of volumes by FY30, led by INGLO’s global readiness, higher EV ASPs, and a strong customer funnel (~80% first-time customers). Here, ICE-like EV profitability is targeted via localization/scale, while meeting CAFÉ norms through a multi-lever strategy (diesel–petrol balancing, CNG/flex-fuel readiness, hybrid options, platform efficiencies, and EV ramp); EV capacity is being expanded from 5k to 8-9k units/month, in the medium term via NU_IQ brownfield additions and a greenfield by CY28. 5) Farm segment outlook has improved, led by higher horticulture profitability and rising per-acre earnings, placing M&M and Swaraj in a dominant competitive position. M&M has thereby raised its FY25-30 industry volume CAGR guidance to 9% (vs 7% earlier); International business is scaling-up, with 10.4% US share for <20HP tractors, 20% Brazil share for <50HP tractors, and rising competitiveness of OJA/NOVO platforms across geographies.
For More Emkay Global Financial Services Ltd Disclaimer http://www.emkayglobal.com/Uploads/disclaimer.pdf & SEBI Registration number is INH000000354
