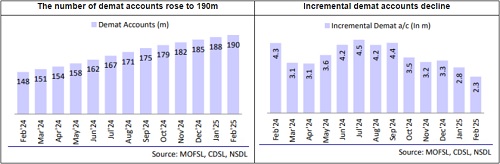
The total number of demat accounts increased to 190m in Feb`25 : Motilal Oswal Financial Services Ltd
According to Motilal Oswal Financial Services Ltd. (MOFSL) report, The total number of demat accounts increased to 190m in Feb’25. However, the incremental demat additions declined sequentially to a 21-month low of 2.3m in Feb’25 (2.8m in Jan’25 and YTD average being 3.5m). In Jan’25, CDSL’s market share for demat accounts remained consistent at ~79%, while it declined with respect to incremental demat accounts at ~85%.
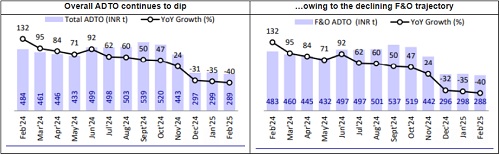
Equity: ADTO on a downward trajectory; BSE’s F&O market share inching up
Total ADTO declined 4% MoM in Feb’25 to INR289t on account of a 4%/5% decline in F&O/cash ADTO to INR288t/INR1t. The option premium ADTO declined 9% MoM to INR594b. In the cash segment, NSE retains its dominant position with a 95% market share in Feb’25. However, BSE continues to attract incremental market share every month in the F&O segment. It had a notional turnover market share of 36% in Feb’25 (36% in Jan’25) and an option premium turnover of 19% (18% in Jan’25).
Commodities: Volumes maintain ~2x YoY growth trajectory
Total volumes on MCX declined 6% MoM to INR53.9t in Feb’25 (up 111% YoY) on account of lower trading days, while ADTO was the highest ever. Option volumes declined 6% MoM to INR48.1t, while futures volumes declined 1% MoM to INR5.8t. Crude oil volumes dipped 22% MoM, which was offset by a 92.2%/225.1% MoM surge in gold/silver volumes and an 8.9% MoM rise in natural gas volumes. In commodity futures, 25%/21% MoM de-growth in crude oil/index volumes was offset by 38%/16% MoM growth in gold/silver volumes.
MF: SIP marginally declines to INR260b; equity inflows drop 26% MoM
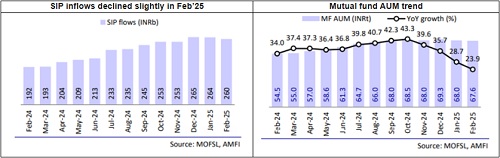
The industry reported an inflow of ~INR401b after witnessing an inflow of INR1.9t in the previous month. This was primarily due to the MoM decline in Liquid/Equity (ex-hybrid) inflows to INR17b/292b, while debt saw outflows of INR82b. Industry MAAUM declined ~1% MoM to INR67.6t. Ex-SIP, net equity inflows (incl. hybrid) declined 54% MoM to INR100b (INR220b in Jan’25).
The equity segment (excl. hybrid) saw net inflows of 292b (v/s INR397b in Jan’25). These inflows were largely contributed by the Sectoral/Thematic Funds (INR57.1b), followed by Flexi Cap fund (INR51b). Large Cap/ Mid Cap/ Small Cap Funds witnessed inflows of INR28.7b/34.1b/37.2b. Overall redemptions in the equity segment declined 7% MoM to INR252b (Jan’25-INR270b). Net equity inflows (ex-NFO) stood at INR267b in Feb’25 vs. INR358b in Jan’25 (decline of 25% MoM).
Hybrid funds witnessed net inflows of INR68b in Feb’25 as compared to INR88b in Jan’25. Inflows were largely contributed by Arbitrage Funds/Multi Asset Allocation funds (INR35.9b/INR22.3b). Redemptions in the hybrid segment declined 17% MoM to INR217b (Jan’25 - INR262b).
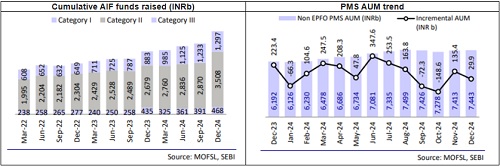
Debt funds reported an outflow of INR82b in Feb’25 (vs inflows of INR151b in Jan’25) driven by outflows of INR226b/ INR428b/INR282b in Overnight / Ultrashort-duration/Low-duration funds. Inflows of INR7.3b/INR10.7b were reported in short-duration/corporate bond funds. Redemptions in the debt fund came in at INR5.1t in Feb’25 vs. INR5.6t in Jan’25. Net inflows for other schemes (mainly passives) were flattish MoM at INR102b in Feb’25. Other ETFs witnessed an inflow of INR38b in Feb’25 compared to INR12b in Jan’25. SIP inflows for the month declined 1.5% MoM to a three-month low of INR260b. AIFs raised the highest ever funds during 3QFY25 of INR779b, largely driven by CAT-II funds, taking the cumulative funds raised to ~INR5.3t. PMS AUM (ex-EPFO) witnessed incremental flows of ~INR30b during Dec’24 taking the AUM to INR~7.4t.
For More Research Reports : Click Here
For More Motilal Oswal Securities Ltd Disclaimer
http://www.motilaloswal.com/MOSLdisclaimer/disclaimer.html
SEBI Registration number is INH000000412


More News

Bank Nifty support is at 49750 then 49500 zones while resistance at 50500 then 50750 zones -...