

Weekly Technical Outlook and Picks : UltraTech Cement Ltd, Dalmia Bharat Ltd, Navin Fluorine International Ltd by Axis Securities Ltd

UltraTech Cement Ltd
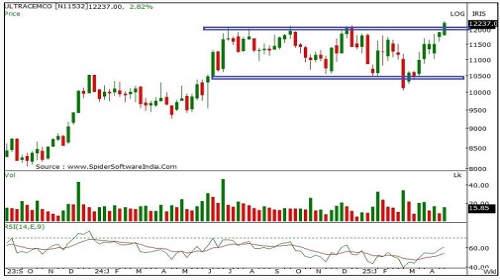
Buy UltraTech Cement Ltd CMP: 12237 Range: 12200-11956 Stop loss: 11580 Upside: 8%–10%
* ULTRACEMCO has shown a decisive breakout above the consolidation zone between 12,140 and 10,300 on the weekly chart, with a robust bullish candle signalling the continuation of its mediumterm uptrend.
* The stock found strong support near 10,490, aligning with the 23.6% Fibonacci retracement of the rally from 5,157 to 12,138 (Jun’22 – Sept’24), and has rebounded sharply from that zone.
* Additionally, the weekly RSI is rising above its reference line, reinforcing bullish momentum.
* The RSI’s breakout above a downwardsloping trendline further confirms the stock’s positive momentum.
* The above analysis indicates an upside toward 13,085-13,300 levels.
* The holding period is 3 to 4 weeks.
Dalmia Bharat Ltd.
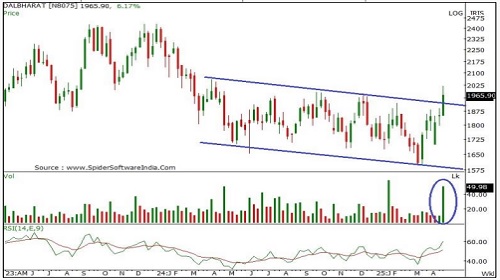
Buy Dalmia Bharat Ltd CMP: 1966 Range: 1935-1897 Stop loss: 1810 Upside: 11% –14%
* DALBHARAT has maintained strong medium-term support near 1,650 since Nov’22 and has recently rebounded sharply, indicating the onset of a fresh medium-term uptrend.
* The stock has given a breakout above a falling channel at 1,906, backed by a strong bullish candle. Elevated volume at the breakout highlights robust market participation, adding conviction to the move.
* It also closed above the weekly upper Bollinger Band, generating a mediumterm buy signal.
* The weekly RSI continues to hold above its reference line, reinforcing the underlying bullish momentum.
* Analysis indicates an upside toward 2,130-2,185 levels.
* The holding period is 3 to 4 weeks.
Navin Fluorine International Ltd
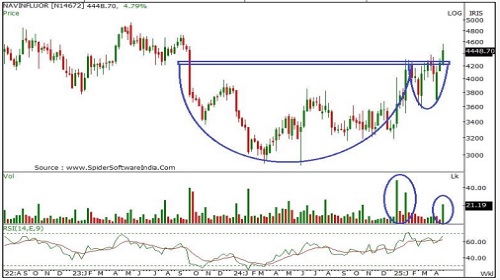
Buy Navin Fluorine International Ltd CMP: 4449 Range: 4385-4299 Stop loss: 4110 Upside: 11%–15%
* NAVINFLOUR has broken out above the Cup and Handle pattern at 4,335 on the weekly chart, signalling the start of a medium-term uptrend.
* While volume remained muted during the pattern formation, a sharp pickup in volume at the breakout confirms strong market participation.
* The stock is trading above its key shortand medium-term moving averages (20, 50, 100, and 200-day), reflecting a firm positive bias.
* The weekly RSI has also given a bullish crossover above its reference line, reinforcing upward momentum.
* A sustained move above 4,435 could ignite fresh buying interest and propel the stock to higher levels.
* The above analysis indicates an upside toward 4,805-4,985 levels.
* The holding period is 3 to 4 weeks. 25 Weekly Technical Outlook and Picks th Apr, 2025 Disclaimer & Disclosures : Axis Securities Limited is a subsidiary
For More Axis Securities Disclaimer https://simplehai.axisdirect.in/disclaimer-home
SEBI Registration number is INZ000161633


.jpg)