Sell Gold Below 141900 SL ABOVE 142800 TGT 140300/139500 - Axis Securities Ltd

Macro
• Gold prices edged higher on Friday as uncertainty surrounding the Iran conflict and the interest rate outlook kept investors cautious. Bullion remained on track for its first monthly gain since February, supported by softer-than-expected U.S. inflation data for June, which eased concerns over imminent interest rate hikes.
• WTI crude oil prices slipped as oil flows from the Persian Gulf increased despite renewed military exchanges between the U.S. and Iran and escalating regional tensions. Both benchmarks were on track for weekly losses of more than 8%, as renewed optimism over potential peace talks earlier in the week continued to weigh on prices.
• Nickel traded around $17,300 per tonne in late July, hovering near its highest level in more than a month. The metal was up over 5% for the month, supported by persistent supply concerns in Indonesia, the world's largest nickel producer.
Panel One
* 15-minute candlesticks for a rolling three-day period have been plotted.
* Blue horizontal line shows an open gap which could either be up or down (open-gap up: low of next candle does not overlap the high of the prior candle, and vice versa for an open-gap down). The horizontal line showing the gap will only appear if the price has not visited the gap area.
Panel Two
* Plots the Slow Stochastics study to identify overbought (90 and above) and oversold (20 and below) areas.
* Signals are generated when the fast line (black) crosses the slow line (blue).
Panel Three
* Plots the Fisher Transform study that helps identify extremes and makes turning points clearer.
* Red bands lie between +2 and +3 and can be thought of as an area where a peak could occur. Green bands lie between -2 and -3 and often mark bottoms.
Gold
SELL GOLD BELOW 141900 SL ABOVE 142800 TGT 140300/139500.
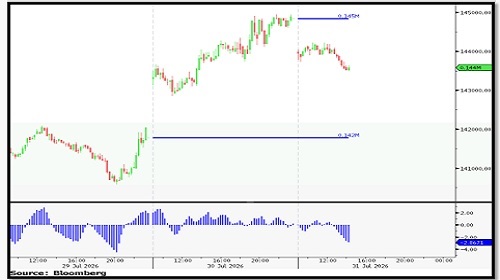
* Nearby Support: 1,41,900/ 1,40,300/ 1,38,500
* Nearby Resistance: 1,43,000/ 1,44,800/ 1,46,400
* Nearby Gaps: 1,45,000.
Silver
SELL SILVER BELOW 217500 SL ABOVE 221000 TGT 212000/207000.
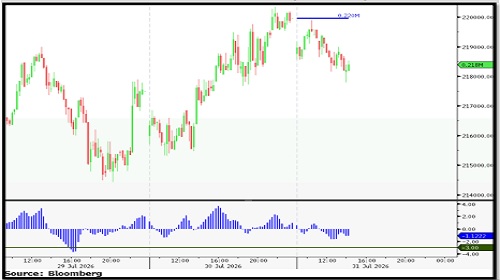
* Nearby Support: 2,17,500/ 2,13,000/ 2,09,000
* Nearby Resistance: 2,20,000/ 2,25,000/ 2,29,000
* Nearby Gaps: 2,20,000.
Crudeoil
BUY CRUDEOIL ABOVE 7950 SL BELOW 7850 TGT 8100/8200.
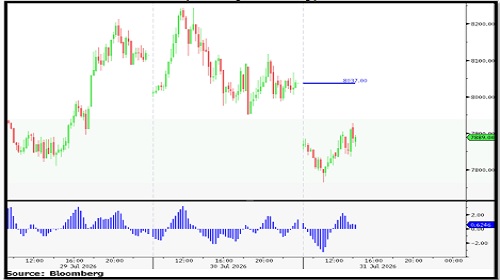
* Nearby Support: 7,750/ 7,600/ 7,450
* Nearby Resistance: 7,950/ 8,100/ 8,270
* Nearby Gap(s): 8.037.
Copper
BUY COPPER ABOVE 1348 SL BELOW 1340 TGT 1358/1365.
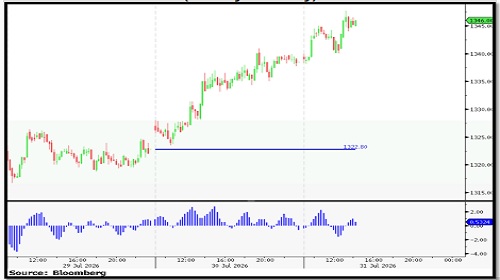
* Nearby Support: 1,338/ 1,329/ 1,320
* Nearby Resistance: 1,348/ 1,356/ 1,365
* Open Gap(s): 1,322.80.
For More Axis Securities Disclaimer https://simplehai.axisdirect.in/disclaimer-home
SEBI Registration number is INZ000161633