Nifty Opens Strong, Recovers Amid Volatility - ICICI Direct Ltd

Nifty : 22555
Technical Outlook
Day that was ..
Equity benchmark snapped its four day’s losing streak and settled on a positive note by gaining 134 points or 0.6% to settle Monday’s session at 22,555. The Nifty Midcap and Smallcap indices followed a similar trajectory, recovering to end higher by 0.7% and 0.5% respectively. Sectoral performance was largely constructive with FMCG, Consumer Durables and PSU Banks emerging as primary drivers. Conversely, the Healthcare and IT segments faced intermittent selling pressure, capping the index's intraday upside after a strong gap-up opening.
Technical Outlook :
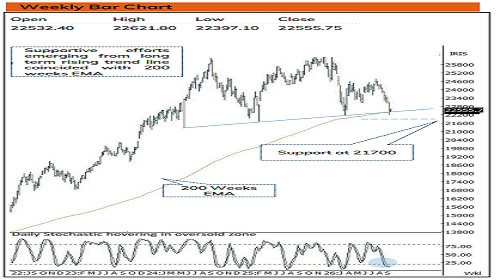
• Index started the week on a subdued note and continued to drift lower as Index started the session with a strong gap-up opening and initially drifted lower before regaining momentum amid volatility. Consequently, daily price action formed a high wave candle, indicating rise in volatility in the vicinity of 200 weeks EMA.
• Despite positive news flow on the financials front, index failed to maintain the initial positive momentum post gap up opening. As a result, failed to close above previous session high over ninth sessions in a row. Therefore, a decisive close above Previous session high is a re-requisite for pausing the ongoing corrective move. Else, continuation of corrective bias wherein strong support is placed at 21700 being April 2025 lows.
• We believe, the Nifty has reached a pivotal moment between capitulation and recovery. While the path ahead remains uncertain, the technical indicators and market breadth suggest that we are approaching bearish extremes. With riskreward favoring the large-caps especially ahead of the earnings season, investors should focus on accumulating stocks backed by strong earnings in a staggered manner. Further, sustainability above 23,100 (on a closing basis) is required to signal a meaningful reversal.
• The current eight-week consecutive decline represents a rare and significant technical event since 2001. This extended correction, coupled with oversold conditions across momentum and breadth indicators, suggests that the market may be due for a technical pullback.
• Momentum indicators highlight a deeply oversold structural base. Large-cap allocations remain historically favorable ahead of the Q2 corporate earnings cycle.
• The daily RSI has bounced slightly from its extreme oversold zone of 22-23, while key stochastic indicators are attempting a bullish cross (on a weekly timeframe) in deeply oversold territory, flashing an early warning that downward velocity is temporarily cooling.
• Approximately 81% of Nifty 500 constituents are trading below their 50-day SMA, signaling a deterioration in market breadth and a stretched market condition that increases the likelihood of a technical rebound
Key Monitorables for the Coming week :
• RBI MPC Interest Rate Announcement (Wednesday)
• Kick-off of Q2 Corporate Earnings Season
• US 10-Year Treasury Yields ,Brent Crude Trajectory
Intraday Rational :
Trend – Supportive efforts from April lows.
Levels – Buy around 50% retracement of 2 days range and Mondays low
Nifty Bank : 54714
Technical Outlook
Day that was :
Bank Nifty ended the day on positive note, at 54714 up 0.48% on back of positive business updates and ahead of key event.
Technical Outlook :
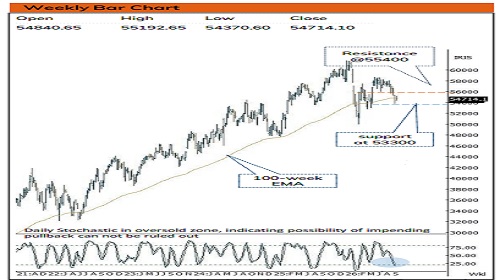
• Bank Nifty started the week with positive opening and thereafter found resistance near previous session high and gave up initial gains. At the fag end buying demand emerged around 54500 levels being 61.8% of two days range(54066-55192). The daily price action formed a second high wave candle with higher high higher low indicating positive bias.
• We believe going forward follow through strength beyond 55400(being last weeks high) would confirm resumption of uptrend and open door towards 56400- 56600 levels being 61.8% retracement of current decline (58025-53785) and 200-day EMA.
• Failure to do so would result into extended correction wherein strong support is placed around crucial support area of 53300 levels being 61.80% retracement of Apr-Jun rally (49955-58706).
• Among oscillators, weekly stochastics is placed at 16 levels rebounding from oversold territory indicating impending pullback.
• The PSU Bank Index formed bull candle with higher high higher low indicating positive bias. Going ahead, support is placed at the lower band of past five months consolidation (9095-7809). While oversold placement of daily and weekly stochastic oscillator warrant for selling exhaustion in coming weeks.
• Intraday Rational :
• Trend - High wave candle at key retracement support
• Levels: Buy around 50% retracement of 2 days range and Mondays low
Please refer disclaimer at https://secure.icicidirect.com/Content/StaticData/Disclaimer.html
SEBI Registration number INZ000183631


.jpg)