Cottoncandy trading range for the day is 50780-54380 - Kedia Advisory

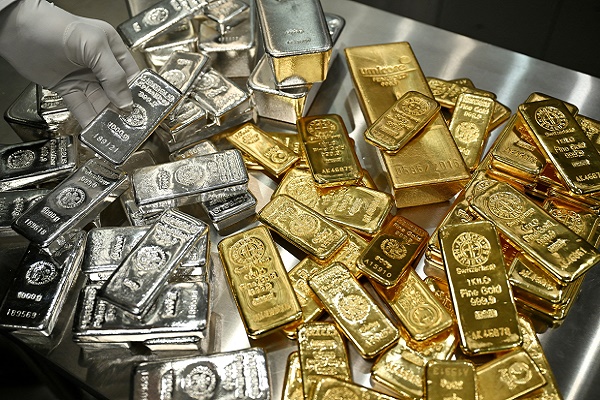
Gold
Daily comment as on Monday, 3 March 2025
Gold prices fell by 1.15% to settle at Rs.84,219 amid a stronger U.S. dollar and investor reaction to fresh U.S. PCE data. The PCE price index rose 0.3% month-over-month in January, aligning with expectations, while the annual rate eased to 2.5% from 2.6%. A surprise 0.2% decline in consumer spending, the first in nearly two years, was offset by a 0.9% surge in income, the highest in a year. Market expectations for Fed rate cuts have now been scaled back to just two this year, as inflation remains above the 2% target. Additionally, U.S. trade policy uncertainty intensified after President Trump confirmed the imposition of 25% tariffs on Mexican and Canadian goods from March 4, alongside a 10% duty on Chinese imports and a potential 25% levy on EU goods. India’s gold demand improved in the second half of the month but remained below normal as prices retreated from record highs. Indian dealers continued to offer discounts ranging from $12 to $27 per ounce, down from the previous week’s $35. Gold imports into India are expected to plunge 85% in February, marking a two-decade low. Meanwhile, in China, gold traded at par or at a discount of up to $3 per ounce, while Singapore saw a range from a $0.50 discount to a $3 premium. Hong Kong dealers offered discounts of $1.8 to premiums of $2.3, while Japanese bullion traded between a $6 discount and a $1.5 premium. Technically, gold is under long liquidation, with open interest dropping by 7.11% to 14,040 contracts. Support is at Rs.83,865, with a potential test of Rs.83,510, while resistance is seen at ?84,745, with a move above possibly pushing prices toward Rs.85,270.
Trading Ideas:
* Gold trading range for the day is 83510-85270.
* Gold fell amid a stronger dollar and as investors digested fresh US PCE data.
* PCE prices rose 0.3% month-over-month in January, while the annual rate eased to 2.5% from 2.6% in December.
* India's gold demand improved in the second half of but remained lower than normal.
Silver
Silver prices declined by 1.28% to settle at Rs.94,328, pressured by demand uncertainties, strong supply, and a firm U.S. dollar. The market reacted to the latest U.S. PCE report, which showed a 0.3% month-over-month rise in prices and a 2.5% year-over-year increase. Consumer spending unexpectedly fell by 0.2%, while income surged by 0.9%. Additionally, concerns grew after President Donald Trump confirmed the implementation of 25% tariffs on Mexican and Canadian goods from March 4, along with an additional 10% duty on Chinese imports. On the supply front, Hecla Mining Company, the largest U.S. silver producer, reported a 13% increase in silver output for 2024, mining 16.2 million ounces—the second-highest production level in its history. However, demand weakened, with U.S. silver coin purchases falling 27% year-over-year in January to 3.5 million ounces, the lowest January demand since 2018. The global silver market is expected to remain in a supply deficit for the fifth consecutive year in 2025, though the deficit is projected to shrink by 19% to 149 million ounces. Industrial demand will continue to be a key driver, with fabrication projected to surpass 700 million ounces for the first time. Silver investment demand is expected to rise by 3%, while jewelry demand is forecast to decline by 6%, with India accounting for most losses due to high prices. Technically, the market is under fresh selling pressure, with open interest rising by 2.53% to 19,786 contracts. Support is seen at Rs.93,740, with a possible test of Rs.93,145, while resistance is at ?95,040, and a move above could push prices toward Rs.95,745.
Trading Ideas:
* Silver trading range for the day is 93145-95745.
* Silver extended losses pressured by demand uncertainties, strong supply, and a firm dollar.
* US PCE prices rising 0.3% month-over-month and 2.5% year-over-year.
* President Donald Trump confirmed that his proposed 25% tariffs on Mexican and Canadian goods will take effect on March 4.
Crude oil
Crude oil prices edged down by 0.28% to settle at Rs.6,118, pressured by geopolitical developments and supply uncertainties. Market sentiment weakened as Washington reaffirmed tariff threats, and Iraq announced the resumption of crude exports from Kurdistan, starting with 185,000 barrels per day through state marketer SOMO, with plans for gradual increases. Uncertainty over OPEC+ production adjustments in April, along with ongoing peace talks regarding the Russia-Ukraine war, further contributed to volatility. Additionally, President Trump revoked Chevron’s license in Venezuela following fresh sanctions on Iran, moves that could tighten global supply. Meanwhile, new tariffs on Mexican and Canadian imports, including a 10% levy on Canadian energy, added to market caution. U.S. crude inventories fell by 2.332 million barrels for the week ending February 21, against expectations of a 2.54 million-barrel build, according to the EIA. However, crude stocks at the Cushing hub increased by 1.282 million barrels, following a previous rise of 1.472 million barrels. Gasoline inventories grew by 0.369 million barrels, while distillate stockpiles surged by 3.908 million barrels, significantly exceeding forecasts. The EIA also revised its crude oil production forecast for 2025, projecting output to average 13.59 million barrels per day, up from the previous estimate of 13.55 million bpd. Technically, crude oil is under long liquidation, with open interest declining by 8.84% to 3,322 contracts. Immediate support is seen at Rs.6,073, with a possible test of Rs.6,029, while resistance is at Rs.6,147, and a move above could push prices toward Rs.6,177.
Trading Ideas:
* Crudeoil trading range for the day is 6029-6177.
* Crude oil dropped as markets braced for Washington's tariff threats and Iraq's decision to resume oil exports from the Kurdistan region.
* Uncertainty surrounding OPEC's production resumption plans in April and ongoing peace talks to end the war in Ukraine also weighed.
* Iraq will export 185,000 barrels per day through state oil marketer SOMO, and that quantity will gradually increase.
Natural gas
Natural gas prices declined by 2.56% to settle at Rs.338.8, pressured by record-high output and forecasts for milder weather, which is expected to curb heating demand. Despite extreme cold earlier in the year leading to record storage withdrawals, stockpiles remain 12% below the five-year average. The latest data from LSEG indicates that average gas production in the Lower 48 U.S. states has climbed to 104.7 billion cubic feet per day (bcfd) in February, up from 102.7 bcfd in January. Output briefly dropped to a three-week low of 100.5 bcfd on February 19 due to freeze-offs but recovered to 106.3 bcfd by February 28 as weather conditions improved. Looking ahead, meteorologists predict continued above-normal temperatures through mid-March, which should keep gas demand lower. LSEG projects that average gas demand, including exports, will decline from 125.7 bcfd this week to 117.7 bcfd next week and further down to 114.0 bcfd in two weeks. Storage withdrawals in the week ending February 21 totaled 261 billion cubic feet (bcf), bringing inventories down to 1,840 bcf. The largest withdrawals were recorded in the South Central (-111 bcf), Midwest (-70 bcf), and East (-57 bcf) regions, leaving storage levels 23.4% lower than a year ago and 11.5% below the five-year average. Technically, the natural gas market is experiencing long liquidation, as open interest fell by 15.52% to 14,604 contracts. Support is seen at Rs.335, with a potential test of Rs.331.1 if the decline continues. On the upside, resistance is at Rs.344.4, and a move above this level could push prices toward Rs.349.9.
Trading Ideas:
* Naturalgas trading range for the day is 331.1-349.9.
* Natural gas eased on record output and forecasts for milder weather.
* Extreme cold so far this year, has already forced energy firms to pull huge amounts of gas out of storage.
* Meteorologists projected weather in the Lower 48 states would remain mostly warmer than normal through March 15.
Copper
Copper prices declined by 0.33% to settle at Rs.861.6 as traders reacted to potential tariff threats from U.S. President Donald Trump. Trump has directed officials to consider tariffs on copper imports to support domestic production, aiming to counter China's dominance in the global copper market. In addition, his confirmation of 25% tariffs on Mexico and Canada, along with a 10% duty on Chinese imports, has escalated trade war concerns, potentially impacting global copper demand, especially from China, the world's largest consumer of the metal. On the supply side, Chile, the world’s top copper producer, reported a 2.1% year-on-year decline in January output to 426,889 metric tons. Meanwhile, the International Copper Study Group (ICSG) reported that the global refined copper market posted a deficit of 22,000 metric tons in December, narrowing from 124,000 metric tons in November. Despite this, the overall market was in a surplus of 301,000 metric tons in 2024, contrasting with a deficit of 52,000 metric tons in 2023. China's refined copper production in December rose 4.3% year-over-year to 1.24 million metric tons, while unwrought copper imports surged 17.8% to 559,000 metric tons. Technically, the market is witnessing fresh selling pressure, as open interest increased by 10.95% to 6,151 contracts. Copper is currently finding support at ?858.1, with further downside potential to Rs.854.6 if selling continues. On the upside, resistance is seen at Rs.864.4, and a move above this level could drive prices toward Rs.867.2.
Trading Ideas:
* Copper trading range for the day is 854.6-867.2.
* Copper dropped as traders weighed the likelihood that President Trump will follow through on his tariff threats
* Trump directed the government to explore potential tariffs on copper imports to boost US production.
* Copper output in Chile, fell 2.1% year-on-year in January to 426,889 metric tons.
Zinc
Zinc prices declined by 0.5% to settle at Rs.266.7 as a stronger dollar and U.S. President Donald Trump’s tariff plans weighed on market sentiment. Trump confirmed that tariffs on Mexico and Canada will take effect on March 4, adding to trade uncertainties. Meanwhile, the People’s Bank of China (PBoC) acknowledged economic headwinds and weak domestic demand, vowing to adjust policy through interest rates and reserve requirements to support recovery. January saw a surge in Chinese bank loans to record levels, reinforcing expectations of further economic stimulus. However, concerns remain over the potential impact of U.S. tariff policies on global trade. On the supply side, global mined zinc production declined for the third consecutive year in 2024, leading to a shift from a surplus of 310,000 metric tons in 2023 to a deficit of 62,000 metric tons in 2024, according to the International Lead and Zinc Study Group (ILZSG). China’s refined zinc production in January rose 1% month-over-month but was down nearly 8% year-over-year, with further declines expected in February due to holiday shutdowns and maintenance-related disruptions in key production regions like Gansu and Yunnan. Meanwhile, China’s net imports of refined zinc surged by 15.5% to 429,000 metric tons, reflecting stronger demand. Technically, the market is under fresh selling pressure as open interest increased by 0.43% to 2,355 contracts. Zinc is finding support at Rs.265.2, with a potential test of Rs.263.6 if bearish momentum continues. On the upside, resistance is seen at Rs.268.2, and a break above this level could push prices toward ?269.6.
Trading Ideas:
* Zinc trading range for the day is 263.6-269.6.
* Zinc prices eased as the dollar firmed on U.S. President Donald Trump's imminent tariff plans.
* PBOC said in its fourth-quarter monetary policy implementation report that it would adjust policy at the appropriate time to support the economy.
* Global mined zinc production fell for the third consecutive year in 2024.
Aluminium
Aluminium prices declined by 0.58% to settle at Rs.257.25 as concerns over a potential trade war and fresh U.S. tariffs weighed on market sentiment. U.S. President Donald Trump’s decision to impose an additional 10% tariff on Chinese imports, along with a 25% tariff on Mexican and Canadian goods effective Tuesday, has raised fears of slowing global economic growth, particularly in China, the world’s largest aluminium consumer. The post-holiday inventory buildup in China added further pressure on prices, with aluminium inventories expected to rise rapidly in the near term. Despite the downward pressure, losses were limited as the EU agreed to ban Russian primary aluminium imports as part of a new sanctions package. The U.S. aluminium premium over the global benchmark on the London Metal Exchange surged by 25% since February 7 and has risen by 60% since Trump’s re-election in November 2024. On the supply side, global primary aluminium production increased by 2.7% year-over-year to 6.252 million tonnes in January, according to the International Aluminium Institute (IAI). China’s aluminium output rose by 4.2% year-over-year in December to 3.77 million metric tons, though daily production dipped slightly from November. Technically, the market remains under fresh selling pressure as open interest increased by 0.52% to 3,069 contracts. Aluminium is finding support at Rs.256.7, with a potential test of Rs.256 if selling persists. Resistance is now seen at Rs.258.4, and a breakout above could push prices toward Rs.259.4.
Trading Ideas:
* Aluminium trading range for the day is 256-259.4.
* Aluminium dropped weighed down by worries about a trade war in retaliation to fresh U.S. tariffs.
* U.S. President Trump threatened to slap an extra duty of 10% on imports from China in addition to a tariff of 10% levied on February 4.
* Investors were also eyeing China’s National People’s Congress meeting scheduled for March 5.
Cottoncandy
Cottoncandy prices declined by 0.71% to settle at Rs.53,130 due to increased supply and limited mill buying. Mills remain well-stocked, reducing immediate purchasing requirements. The rise in Brazil’s 2024-25 cotton production, projected at 3.7616 million tons (1.6% higher), along with a 4.8% expansion in planting area, indicates strong supply potential in the global market. Additionally, the Cotton Corporation of India (CCI) is expected to procure over 100 lakh bales at the Minimum Support Price (MSP) during the current cotton year, providing some price stability. The Cotton Association of India (CAI) estimates a decline in India’s cotton output for the 2024-25 season to 301.75 lakh bales, down from 327.45 lakh bales in 2023-24, mainly due to lower yields in Gujarat, Punjab, and Haryana. However, the overall cotton quality remains high. As of January 2025, total cotton supply is estimated at 234.26 lakh bales, including fresh pressings of 188.07 lakh bales, imports of 16 lakh bales, and opening stocks of 30.19 lakh bales. Domestic consumption is projected at 315 lakh bales, while exports are expected to decline to 17 lakh bales from 28.36 lakh bales in the previous season. In the U.S., domestic mill use has been reduced by 100,000 bales, increasing ending stocks to a 39% stock-to-use ratio. Technically, the market is under long liquidation, with open interest remaining unchanged at 253 contracts while prices dropped by Rs.380. Cottoncandy has support at Rs.51,960, with a further test at Rs.50,780 possible, while resistance is seen at Rs.53,760, with a break above leading to Rs.54,380.
Trading Ideas:
* Cottoncandy trading range for the day is 50780-54380.
* Cotton dropped due to a substantial increase in supply and limited mill buying.
* Mills are well-stocked and are not facing immediate purchasing requirements.
* Brazil’s 2024-25 cotton production is projected to be 1.6 per cent higher at 3.7616 million tons
* In Rajkot, a major spot market, the price ended at 25481.1 Rupees dropped by -0.43 percent.
Turmeric
Turmeric prices declined by 0.57% to settle at 12,450 as the arrival of the new crop commenced in key markets like Nizamabad and Hingoli. Despite an increase in acreage to 3.30 lakh hectares this season—10% higher than last year’s 3 lakh hectares—untimely rains have impacted productivity, limiting the overall production rise. In major producing areas like Nanded, productivity is expected to decline by 10-15%, which could result in total production either matching last year’s 10.75 lakh tonnes or fluctuating by 3-5%. While the increased acreage initially suggested higher yields, the adverse weather conditions have led to concerns over smaller rhizomes and crop rot, particularly in the Nanded region. The confirmation of exact production losses will only be possible once harvesting progresses in the key producing areas. However, supply-side concerns are providing some support to prices. On the trade front, turmeric exports during April–November 2024 rose by 9.80% to 121,601.21 tonnes compared to 110,745.34 tonnes in the same period of 2023. Notably, November 2024 exports stood at 12,721.25 tonnes, marking a significant 48.22% increase from November 2023. Meanwhile, imports also surged by 101.80% during April–November 2024, reflecting a growing demand. Technically, the turmeric market is experiencing long liquidation, with open interest dropping by 0.39% to settle at 12,695 contracts. Immediate support is seen at 12,388, with a break below potentially testing 12,326 levels. On the upside, resistance is placed at 12,546, and a move above this could push prices toward 12,642.
Trading Ideas:
* Turmeric trading range for the day is 12326-12642.
* Turmeric prices dropped as arrival of new turmeric crop has started.
* New turmeric crop is arriving in Nizamabad and Hingoli Mandi.
* However downside seen limited as new crop yields are expected to be 10-15% lower this year.
* In Nizamabad, a major spot market, the price ended at 12849.9 Rupees dropped by -1.71 percent.
Jeera
Jeera prices rose by 0.42% to settle at 21,335 as the arrival of the new crop in Gujarat has been delayed by about a month due to unfavorable weather conditions. The delayed sowing in major producing states like Gujarat and Rajasthan has influenced market sentiment. However, the upside remains limited as demand remains subdued, and current export requirements are being met through available stock. Farmers still hold approximately 20 lakh bags of cumin, with only 3-4 lakh bags expected to be traded by the end of the season, leading to a significant carry-forward stock of around 16 lakh bags. India’s cumin seed production is expected to reach 8.6 lakh tonnes in the 2023-24 season, up from 5.77 lakh tonnes in the previous year, supported by an increased sowing area of over 11.87 lakh hectares. Despite ample supply, India remains the cheapest global supplier, attracting buyers from key markets, including China. Jeera exports saw a remarkable 74.04% increase during April–November 2024, reaching 147,006.20 tonnes compared to 84,467.16 tonnes in the same period last year. However, November 2024 exports fell by 28.92% from October but showed a 42.67% year-on-year rise. Technically, the market is experiencing short covering, with open interest dropping by 4.75% to settle at 2,529 contracts. Immediate support is seen at 21,200, with a break below possibly testing 21,070 levels. Resistance is placed at 21,460, and a move above this could push prices towards 21,590.
Trading Ideas:
* Jeera trading range for the day is 21070-21590.
* Jeera gains as the start of the new crop of cumin in Gujarat has been delayed by about a month.
* However upside seen limited as demand is low and the current export business is being met from the available stock.
* The current season is expected to have similar production levels as last year due to better crop conditions and good sowing.
* In Unjha, a major spot market, the price ended at 21331.5 Rupees dropped by -0.72 percent.
Views express by all participants are for information & academic purpose only. Kindly read disclaimer before referring below views