Buy Astral Ltd For Target Rs. 1,600 By Geojit Financial Services Ltd

Fundamental View
Astral Ltd. (Astral), incorporated in 1996, is one of the fastest growing and leading companies in the category of building materials with presence across pipes & bathware (71%) and adhesives(25%) and Paints (4%) as of 9MFY25. It is among India's leading players in the high -margin CPVC pipes and fittings business.
• Revenue grew modestly by ~3%YoY to ?4,151cr in 9MFY25, supported by aggregate volume growth in the plumbing business of ~4%, despite moderation in realisation.
• The lower realisation was because of polymer price volatility, weak construction and agricultural demand due to an extended monsoon, and a slowdown in government infrastructure spending.
• EBITDA grew just by ~3% YoY, while EBITDA margins contracted by ~10 bps YoY to ~16.3% in 9MFY25 on the back of higher employee costs and expansion-related expenses. Consequently, PAT declined by ~6.5%YoY to ?341cr in 9MFY25.
• However, for Q3FY25, EBITDA grew by ~9%YoY while EBITDA margins expanded by ~110bps YoY to ~16.5%, signalling a potential margin improvement in coming quarters.
• The profitability is poised to recover in FY26E, led by stabilized raw material costs, healthy share of value-added products, strategic expansions, and enhanced operational efficiencies.
• As per market consensus, Astral Ltd. is currently trading at 1year fwd. P/E of 51x (which is at ~23% discount to 5 year Avg P/E. 67x). The long-term growth story of Astral is intact on the back of superior product mix, leadership within CVC pipes segment, new launches, an extensive distribution network and a healthy balance sheet. Astral is trading at comfortable valuation at current levels.
Technical View
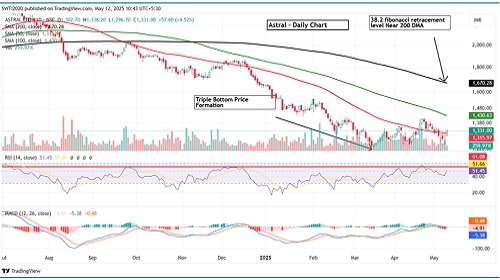
• The stock has formed a triple bottom pattern on the daily chart following a sharp correction from July 2024 to March 2025. It has now reclaimed the 50-day moving average (50-DMA) and is trading firmly above it, supported by strong volume action.
• Momentum indicators also support the bullish outlook. The daily RSI shows improving momentum, consistently forming higher peaks and higher troughs, and is currently positioned around 52. Meanwhile, the MACD is hovering near its central line.
• Following a ~50% decline from its all-time high, the recent rebound and strong base formation suggest a potential trend reversal. The stock now appears poised to test the 200-DMA as well as the 38.2% Fibonacci retracement level in the near term.
For More Geojit Financial Services Ltd Disclaimer https://www.geojit.com/disclaimer
SEBI Registration Number: INH200000345


.jpg)